Quartz micro and nanoparticles are used in a wide variety of industries, particularly in semiconductors and optics, and as a filler for epoxy resins1. During the preparation of these particles, it is essential to understand and manage one crucial parameter: particle size distribution. Also, the shape and texture of these particles have a significant impact on the material’s mechanical strength, density, electrical and thermal properties2.
Quartz nanoparticles are analyzed mainly by laser diffraction. This method offers many advantages but does not allow visualization of true particle morphology. A team of researchers from the Environmental Electron Microscopy Group at the Institute of Scientific Instruments of the Czech Academy of Sciences3 (Brno, Czech Republic) used dedicated electron microscopy methods for a more comprehensive analysis: scanning electron microscopy (SEM), advanced environmental scanning electron microscopy (A-ESEM), focused ion beam scanning electron microscopy (FIB-SEM) and serial block-face scanning electron microscopy (SBF-SEM).
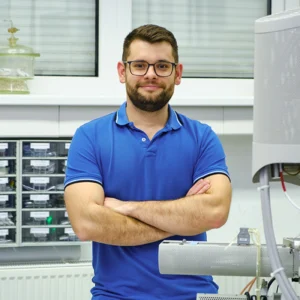
Martin Olbert is a PhD student in the Environmental Electron Microscopy Group at the Institute of Scientific Instruments of the Czech Academy of Sciences (Brno, Czech Republic).
Particle analysis of SEM/ESEM images
“We analyzed the samples in two forms: as a raw quartz powder and as a powder in epoxy resin as the final product,” explains Martin Olbert, one of the researchers involved in the study.
“After we optimized the sample preparation, we were able to observe the raw quartz powder and its embedment in the resin with the help of our ESEM Aquasem II microscope and a self-modified high-resolution microscope ESEM QUANTA 650 FEG.”
“In order to compare the environmental conditions during imaging, micrographs were taken under vacuum and at a water vapor pressure of 200 Pa in the sample chamber. Self-developed detectors were used to obtain different types of electron signals, which provided complex morphological information about the investigated samples.”
A major challenge in this study was to accurately identify the particles. “In order to remedy this problem”, states Olbert, “We developed a special post-processing algorithm, based on the creation of a binary mask, which precisely follows the edge of each particle. Thus, a clear particle substrate interface was created” (Fig. 1 A, B).
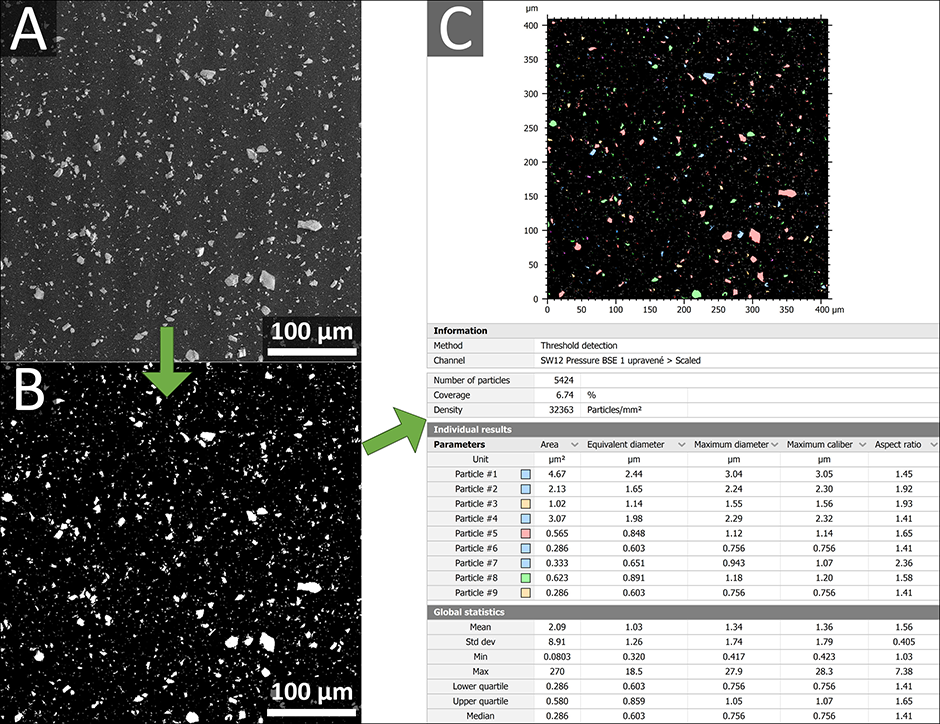
Figure 1. Particle analysis of SEM/A- ESEM images using MountainsSEM® Expert software. A) Original image of the sample. B) The same image in the form of a binary mask, for better particle detection – particles are visible in white, the background in black. C) Grains are detected after application of the “Binary thresholding” function in MountainsSEM® Expert.
“We then used MountainsSEM® Expert software Particle analysis tool to automatically identify all particles, having selected the “Threshold detection” method (Fig. 1 C). Detailed statistics of individual particle size distribution were obtained. “
Automating the analysis protocol
“By simply creating a template containing our previously defined analysis approach, we were able to quickly and efficiently process all additional images, thus providing a relevant and robust statistical output. MountainsSEM® also allowed us to evaluate a large number of other parameters such as aspect ratio, roundness, area and orientation.”
“Next, we analyzed the particles embedded in the resin with a FIB-SEM Tescan Amber microscope and an SBF-SEM Tescan Clara UHR SEM microscope equipped with ConnectomX ultramicrotome. The data obtained was subsequently evaluated to obtain a 3D model and statistical evaluation.
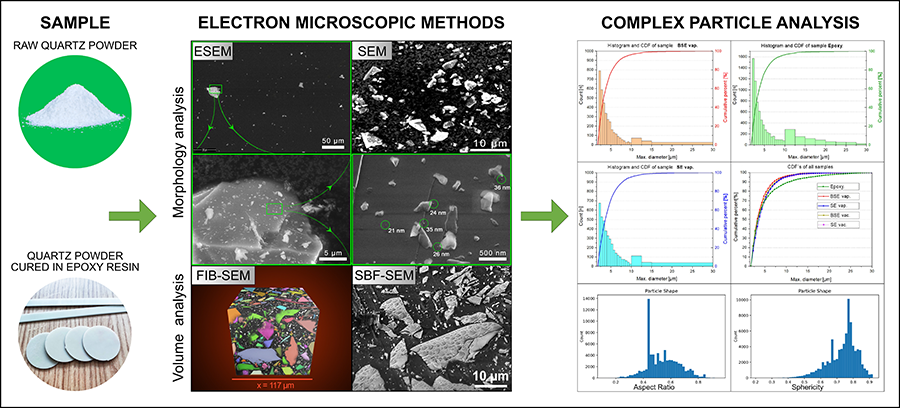
Figure 2. An overview of the study. Using several microscopic methods, a sample of quartz powder in two different forms was analyzed to obtain a comprehensive and accurate description of the sample characteristics.
“Overall, with the use of both SEM and A-ESEM methods, we were able to image not only the powder particles but also the particles embedded in the resin, making it possible to fully understand the production and use of these particles in products. The techniques used also allowed us to quantify additional morphological parameters and provide information on the exact shape of the particles.”
“A-ESEM is a fully-fledged innovative method that brings a number of advantages to particle analyses, such as a significant reduction in sample charging — thus avoiding the formation of image artifacts that distort the resulting statistics — and the reduced risk of microscope damage due to contamination of released particles. A-ESEM is capable of imaging electrically non-conducting particles without prior treatment and revealing structural details of sub-micrometer sized particles.”
“FIB-SEM is one of the most modern and advanced tools for the measurement of 3D morphological properties of particles, in particular for their spatial distribution.”
“The methods applied in this study, including the use of MountainsSEM® software, allowed us to image particles in a wide range of sizes, and to statistically evaluate many morphological properties in a comprehensive way (Fig. 2).”
References
[1] Quartz: Deposits, Mineralogy and Analytics. J. Götze, R. Möckel. In: Springer Berlin Heidelberg, 2012, https://doi.org/10.1007/978-3-642-22161-3.
[2] Particle size analysis on wide size distribution powders; effect of sampling and characterization technique. G.B. Basim, M. Khalili. In: Advanced Powder Technology, Vol. 26, 2015, p. 200–207, https://doi.org/10.1016/j.apt.2014.09.009.
[3] https://www.aesemgroup.eu/en
Read more
Size and shape analysis of micro- to nano-particles of quartz powders using advanced electron microscopy and laser diffraction methods. M. Olbert, V. Nedela, J. Jirak, J. Hudec. In: Powder Technology, Vol. 433, 2024, 119250. https://doi.org/10.1016/j.powtec.2023.119250
The research was co-financed by the new CAS Strategy AV21 program The Power of Objects: Materiality Between Past and Future.
Instruments & software used
ESEM Aquasem II microscope, ESEM QUANTA 650 FEG microscope, FIB-SEM Tescan Amber, SBF-SEM Tescan Clara UHR SEM + MountainsSEM® software (including particle analysis)
See more surface analysis stories: