Nanoparticles are used in many common commercial products like cosmetics, foods, pharmaceuticals and require very specific capabilities for their characterization at the nanometer scale. For this application, a research team at the LNE Nanotech Institute (France) combined measurements from several instrument techniques including Atomic Force Microscopy (AFM) and Scanning Electron Microscope (SEM) equipped with a new-generation energy dispersive X-ray detector (EDX).
![]()
![]()
In order to correlate the collected data and extract the relevant information, software with advanced processing capability was required. For this purpose, MountainsLab® developed by Digital Surf is particularly well adapted.
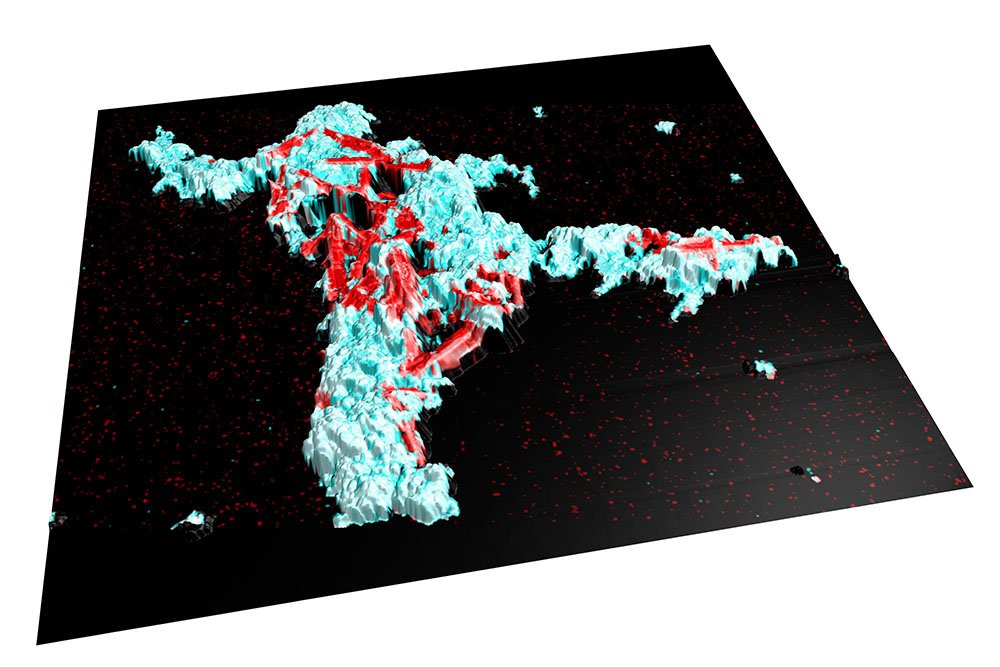
Above. 3D view of colocalized data (AFM topography + SEM image + EDX data).
Characterizing nanoparticles in mixtures
One of the problems regularly encountered in the measurement of nanoparticles are mixtures. Indeed, many products include several populations of nanoparticles to satisfy several needs. For example, to give an orange color to a product, the coloring agents TiO2 (white pigment) and Fe2O3 (red pigment) are mixed.
However, regulatory authorities require producers and suppliers to clearly determine the size and size distribution of each nanoparticle population. This step remains a challenge in the case of mixtures. The correlation of AFM/SEM/EDX measurements is thus a solution to this problem.
AFM and SEM data provide structural information on the particles. Indeed, AFM gives very precise information along the vertical axis, whereas the SEM provides a very high resolution in the plane. EDX is then used as a complementary tool to enable chemical identification and classification of each particle on the microscopy images.
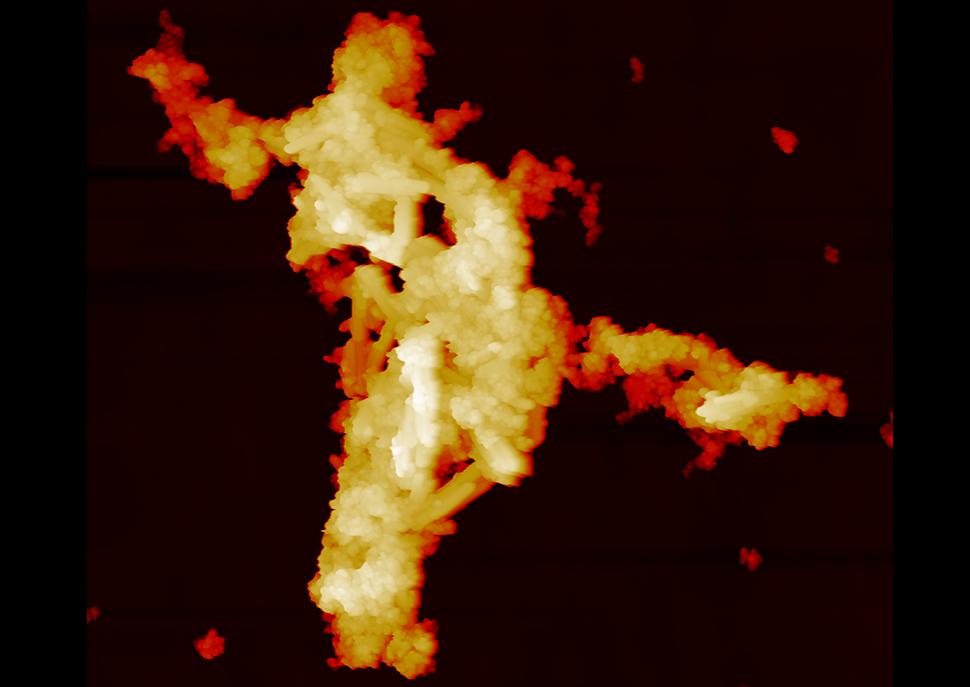
Above. AFM topography of a nanoparticle mixture
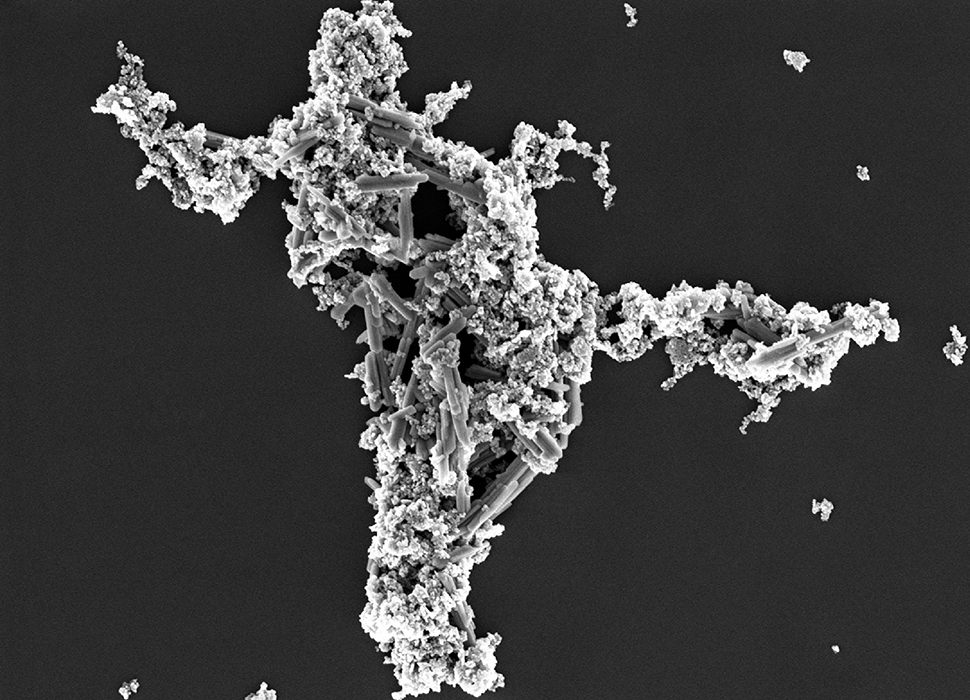
Above. SEM image of the same surface
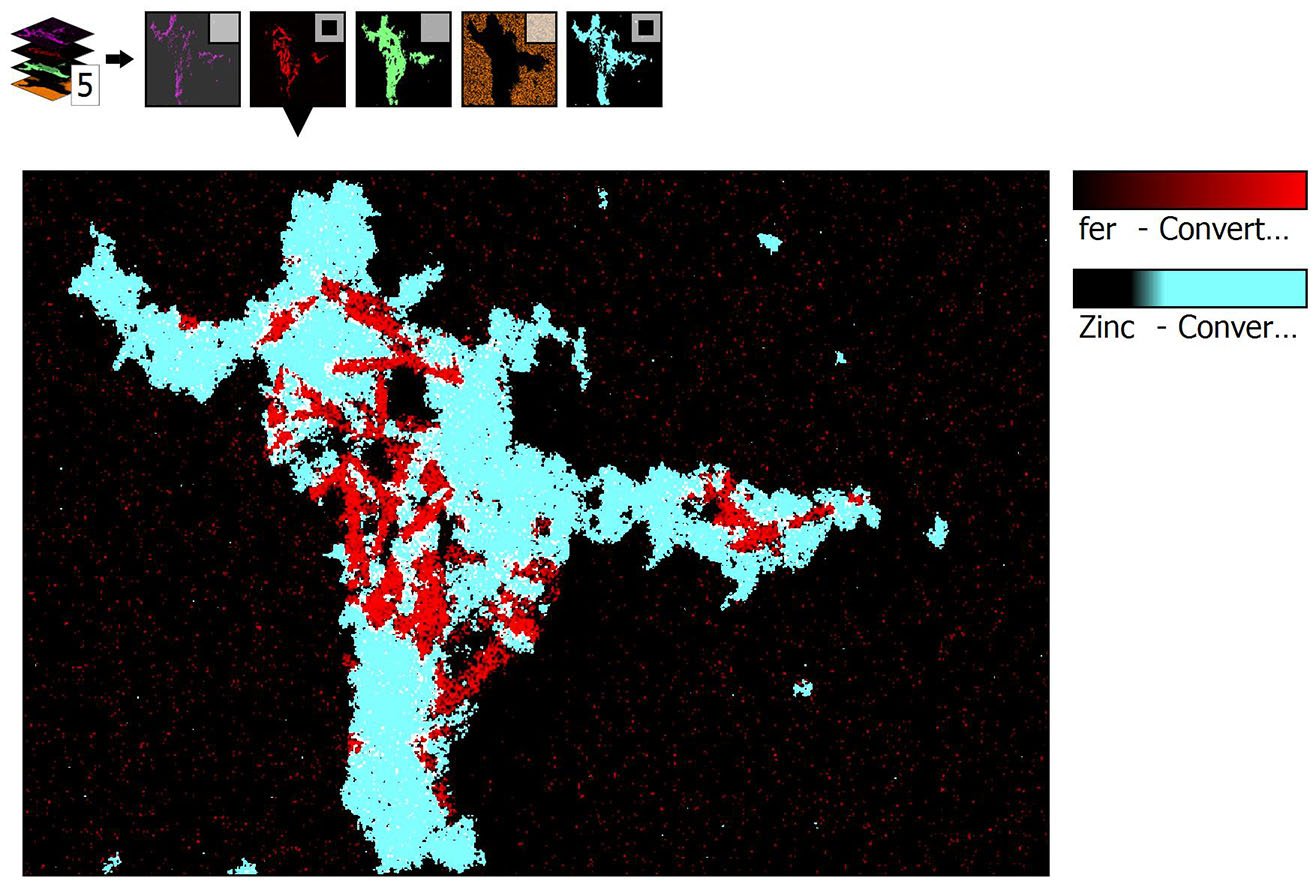
Above. EDX data. Areas high in zinc are shown in blue; areas high in iron are displayed in red.
Determining size distribution by correlation
In a recent study on a mixture of ZnO & Fe2O3, we demonstrated that the size distribution of each population is accessible by this combining technique. 3 steps are crucial to achieve the result:
- The sample is correctly prepared to avoid any agglomeration.
- The region of interest on the substrate is localized in order to image the same particles with different instruments.
- Correlation of the image data obtained is performed.
As each technique provides images associated with different information and reflecting its own limitations (calibration, dilatations, etc.), correlation can be very difficult to implement without post-processing. MountainsLab® software offers a large range of tools which allowed us to process the various datasets.
Firstly, each image was processed independently. For example, the AFM image was leveled. Then, thanks to the “Colocalization” tool, the AFM and SEM images were combined to obtain an image of the topography of the sample with high resolution in three dimensions. The resulting “image” is then further combined with EDX mapping (Fe and Zn).
Since the correlative image obtained gives us information in 3D, it is possible to obtain an estimation of the volume, size and size distribution of each nanoparticle population imaged.
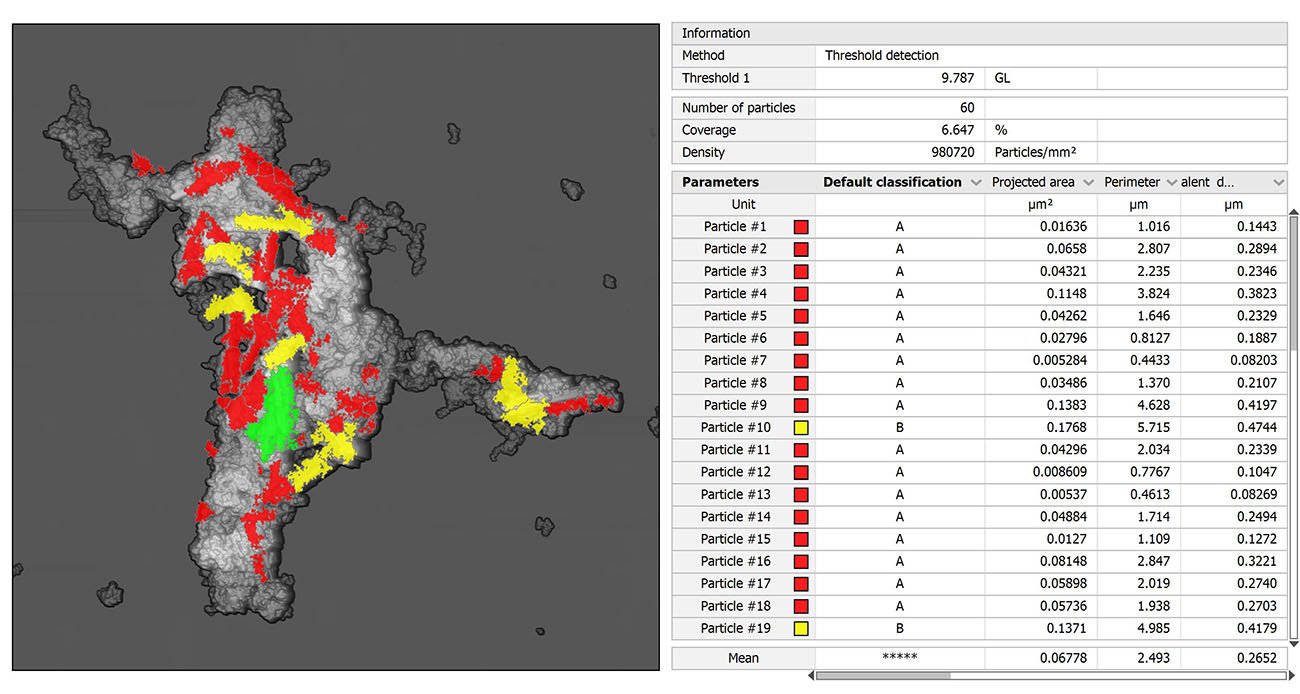
Above. Particle analysis performed on correlated data showing areas, volumes etc.
About the authors
Alexandra Delvallée, Sébastien Ducourtieux, Loïc Crouzier and Mouna Oulalite are members of the Nanometrology group at LNE (French National Laboratory of Metrology and Testing). Learn more: www.lne.fr/fr/LNE-Nanotech
Instruments and software used
Atomic Force Microscope + Scanning Electron Microscope + Energy Dispersive X ray spectroscopy + MountainsLab® software.