


In vehicle braking systems, surface topography plays a critical role in friction, wear and overall function. Understanding how surface structures evolve over time and interact at different scales is therefore essential for improving tribological performance.
This challenge is at the core of the research recently conducted by a team of French researchers from the LAMIH UMR CNRS 8201 and LaMcube UMR CNRS 9013 laboratories, authors of a scientific publication investigating multiscale topographical analysis of brake friction1. The study relied extensively on MountainsMap® software to analyze, visualize and process large volumes of surface topography data.
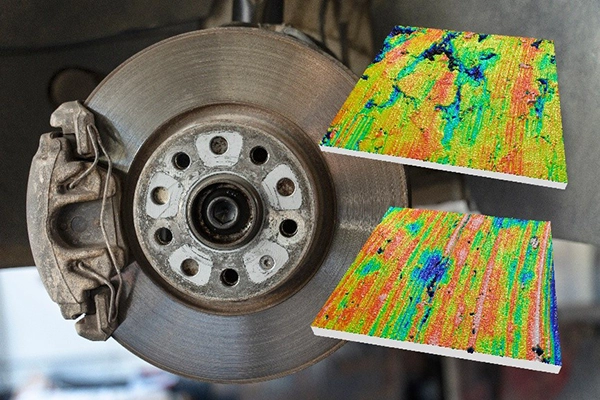
A workflow designed for large-scale tribological studies
In the study, the team used MountainsMap® across four major stages: data quality control, surface inspection, automated calculations and scientific interpretation.
Ensuring the quality of topography measurements
Before any analysis begins, every measured surface is visually inspected to guarantee data reliability.
“Even when I work with several thousand surfaces, I systematically inspect each one individually,” comments Robin Guibert, surface analysis expert and founder at Anscale², one of the researchers involved in the study.
This quality-control phase relies on MountainsMap® visualization tools including 3D view, photo simulation, surface series visualization and 4D views for time-evolving surfaces.
The objective at this stage is to detect and rectify potential measurement artefacts such as inconsistent signals, stitching defects or large non-measured areas.
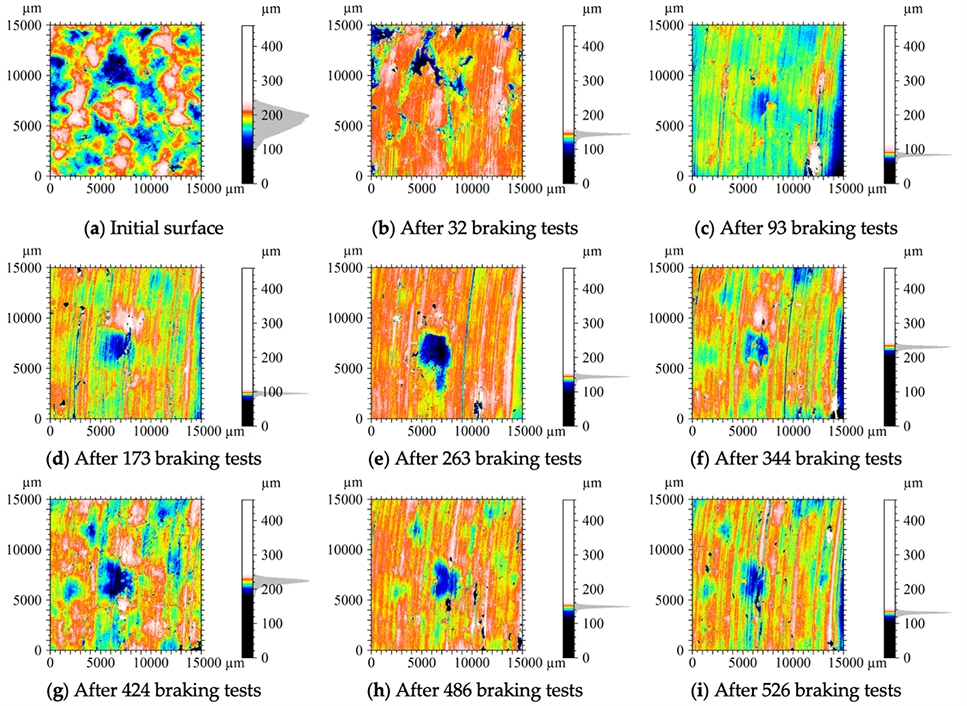
Above. Topographies of the braking pad surface after various numbers of braking tests.
Investigating the morphology of friction surfaces
Once validated, the surfaces are explored in detail to identify the morphological structures influencing tribological behavior.
For this stage, the team used:
- 3D view
- height histograms
- photo simulation
- watershed-based particle analysis
- profile extraction
- Gaussian and robust Gaussian filtering
- Abbott-Firestone curves.
These tools help characterize the size, shape and distribution of surface features involved in friction and wear processes.
“In the early stages of analysis, I intentionally avoid focusing too much on roughness parameters. I first try to understand the morphology and organization of the surface structures visually” explains Robin Guibert.
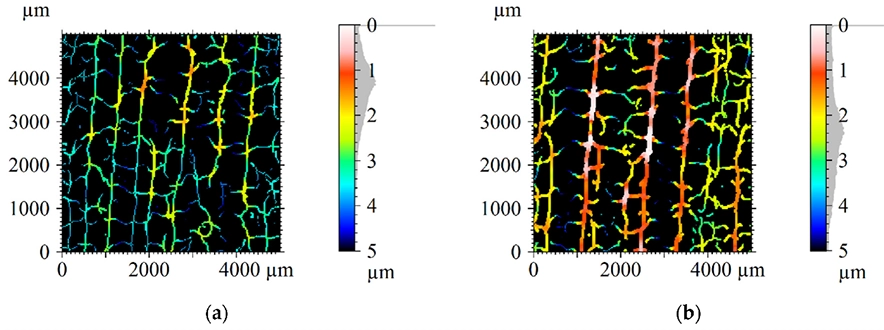
Above. Furrow analysis of topographies of braking pad surfaces filtered with a robust Gaussian low-pass filter at scale 446 µm.
Calculating roughness parameters on more than 200,000 surfaces
The third stage of the workflow focuses on large-scale automated surface correction, filtering and parameter calculations. In some cases, it was necessary to calculate roughness parameters on more than 200,000 surfaces.
To process these extremely large datasets efficiently, Robin Guibert developed an advanced MATLAB automation framework inspired by the MESRUG program originally developed by Professor Maxence Bigerelle, one of the other authors of the publication.
This system automatically controls MountainsMap® in “batch mode” and orchestrates multiple parallel processing tasks.
“In a way, I use MountainsMap® as a graphical programming language where each .mnt file behaves like a reusable function” says Robin.
This automation framework can launch up to 12 parallel instances of MountainsMap® simultaneously.
“MountainsMap® is robust enough to run fully automated calculations continuously for several weeks” states Robin.
Using this framework, the team performed:
- form removal
- filling of non-measured points
- metrological filtering
- multi-scale decomposition
- particle analysis
- roughness parameter calculations
The publication authors confirmed that for tribology research, ISO compliance is a major reason for relying on MountainsMap®.
From surface data to tribological insights
Beyond roughness calculations, the final objective of the workflow is to generate meaningful scientific insights.
Using this approach, the team at Anscale was able to identify the surface features that most strongly influence tribological behavior. Similar methodologies can be applied to a wide range of industrial challenges involving wear, friction, adhesion, sealing or functional surface optimization.
At this stage, the team correlated:
- surface morphology
- roughness parameters
- tribological test bench results
- physical context
- and theoretical models.
MountainsMap® played a central role thanks to its advanced visualization capabilities and its ability to compare multiple surfaces simultaneously.
3D visualizations, photo simulations, particle analyses and parameter tables were all used to create publication-ready figures and better highlight friction-related mechanisms.
Multiscale analysis allows honing and cutting mechanisms to be distinguished based on their characteristic scales. Honing truncates surface peaks, generating wear plateaus, whereas cutting generates grooves across the pad surface. Also, third body trapped in the wear tracks can be compacted into plateaus.
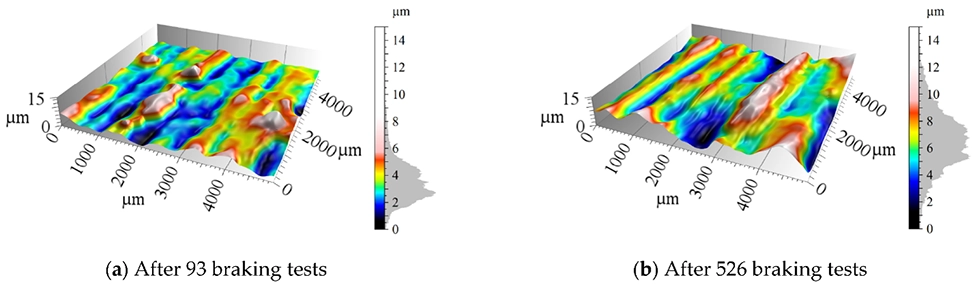
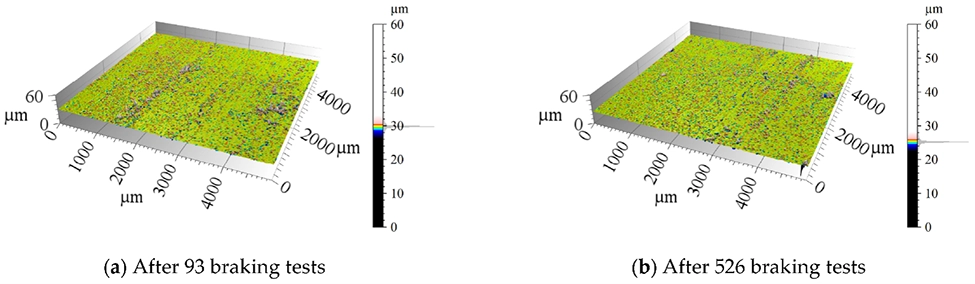
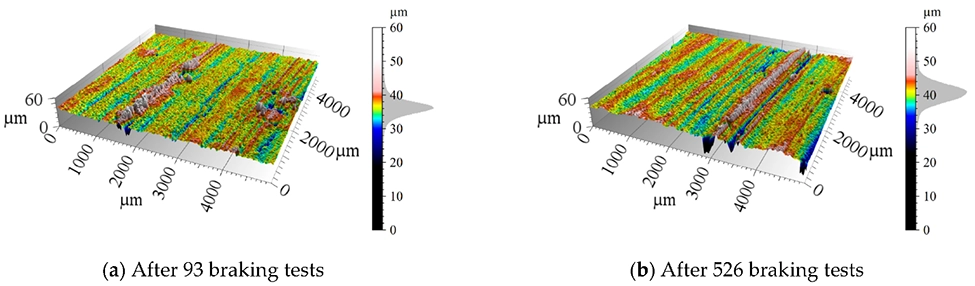
Above. Filtered topographies with (top) a robust Gaussian low-pass filter at scale 446 µm (middle) with a robust Gaussian high-pass filter at scale 19.5 µm and (bottom) with a robust Gaussian high-pass filter at scale 2717 µm.
Key findings: identifying the surface scales that govern brake friction
One of the most significant outcomes of the study was the identification of specific surface scales directly linked to brake friction performance and wear.
The researchers demonstrated that different tribological phenomena are governed by different topographical scales. Surface wear was strongly associated with mesoscopic plateaus around 0.5 mm, while braking efficiency was linked to summit density at much smaller scales around 20 µm.
The study also highlighted the central role of wear plateaus formed during braking. These plateaus originate either from damaged surface peaks or from the compaction of third-body particles trapped within the surface texture.
More broadly, the research demonstrated that brake friction cannot be understood using a single roughness parameter or a single observation scale. Instead, the combination of multi-scale surface analysis, ISO-compliant roughness calculations and advanced visualization provides a powerful framework for understanding and optimizing braking systems.
References
1Guibert, R.; Thévenot, M.; Lemesle, J.; Coustenoble, L.; Brunel, J.-F.; Dufrénoy, P.; Bigerelle, M. Multiscale and Multiphysics Topographical Analysis of Brake Friction Material Related to Friction Performance. Lubricants 2026, 14, 139. https://doi.org/10.3390/lubricants14030139
²Anscale – www.anscale.fr – Surface topography consulting and analysis services – Contact: Robin Guibert — robinguibert@anscale.fr
Other contacts
- LAMIH UMR CNRS 8201 – Morphoméca platform – Topography measurement and surface characterization services – Contact: Maxence Bigerelle — bigerelle@gmail.com
- LaMcube UMR CNRS 9013 “Mechanisms induced by friction & braking” team – Contact: Jean-François Brunel — jean-francois.brunel@univ-lille.fr
Instruments & software used
Focus variation microscopy (PortableRL, Bruker Alicona) + MountainsMap® software
More surface analysis stories
- Bringing next-generation head-up displays to life
- Revealing key topographic parameters in surface bacterial adhesion
- Multi-perspective characterization of tool performance
Brake pad image acknowledgements: designed by Freepik – Magnific.com