


Digital Surf releases version 11.3 of its Mountains® software platform. Let’s take a closer look at what’s included in this new release.
Cross-technology features
More powerful 3D visualization
Navigate, interpret and present your 3D data with greater clarity
- Find your way instantly with a one-click camera reset that returns to the default viewpoint
- Applied vertical amplification now immediately visible
- Measure distances more easily using configurable XY quadrilateral (grid) lines aligned with axis graduations or custom spacing to verify surface periodicity
- Read surface heights directly with configurable Z contour lines overlaid on the 3D view
- Create more impactful visualizations with customizable grid and contour overlays
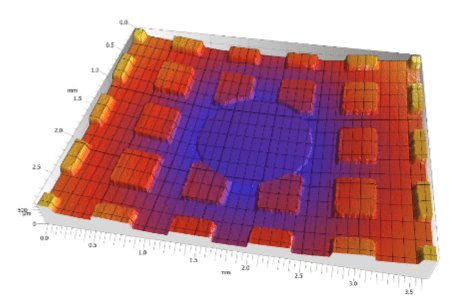
XY quadrilateral (grid) lines automatically aligned with axis graduations
Improvements to illustrations
Create clearer, more interactive documents with improved editing and hyperlink options
- Choose how hyperlinks are pasted – as active hyperlinks, buttons or plain text – and save your preferred behavior
- Recall the current operator directly from a new action button
- Edit illustrations more naturally by deleting text boxes with a single press of the Delete key
- Improved button readability with automatic multi-line text wrapping

Asynchronous calculations for quicker visualization
Work faster with more responsive operator dialogues, even on large datasets
- Make multiple changes without waiting for each calculation to finish
- Continue working while computations run seamlessly in the background
- Benefit from optimized processing that recalculates only what is necessary
- Supported by an expanding range of operators across Mountains® technologies
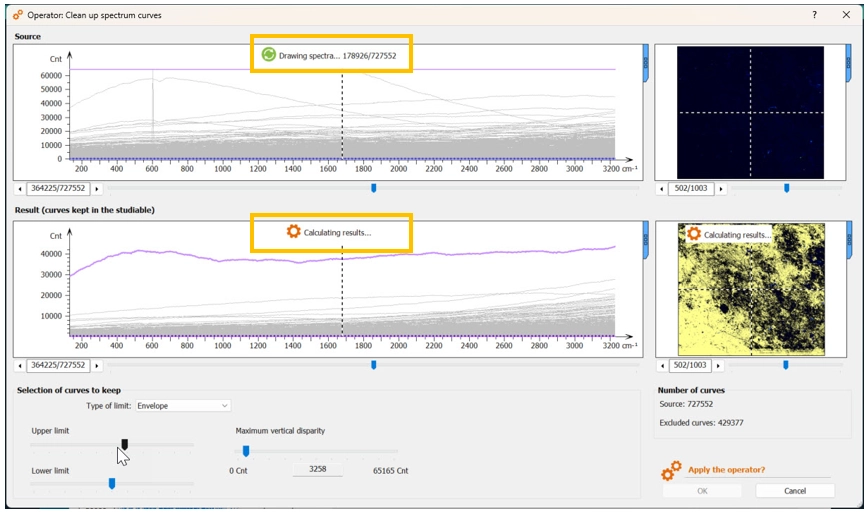
Adjust sliders and switch visualization modes fluidly even when working with large datasets.
Example: Clean up spectrum curves operator on dataset containing over 700K spectra.
Neighbor parameters in Particle Analysis
Explore particle relationships with new nearest-neighbor measurements
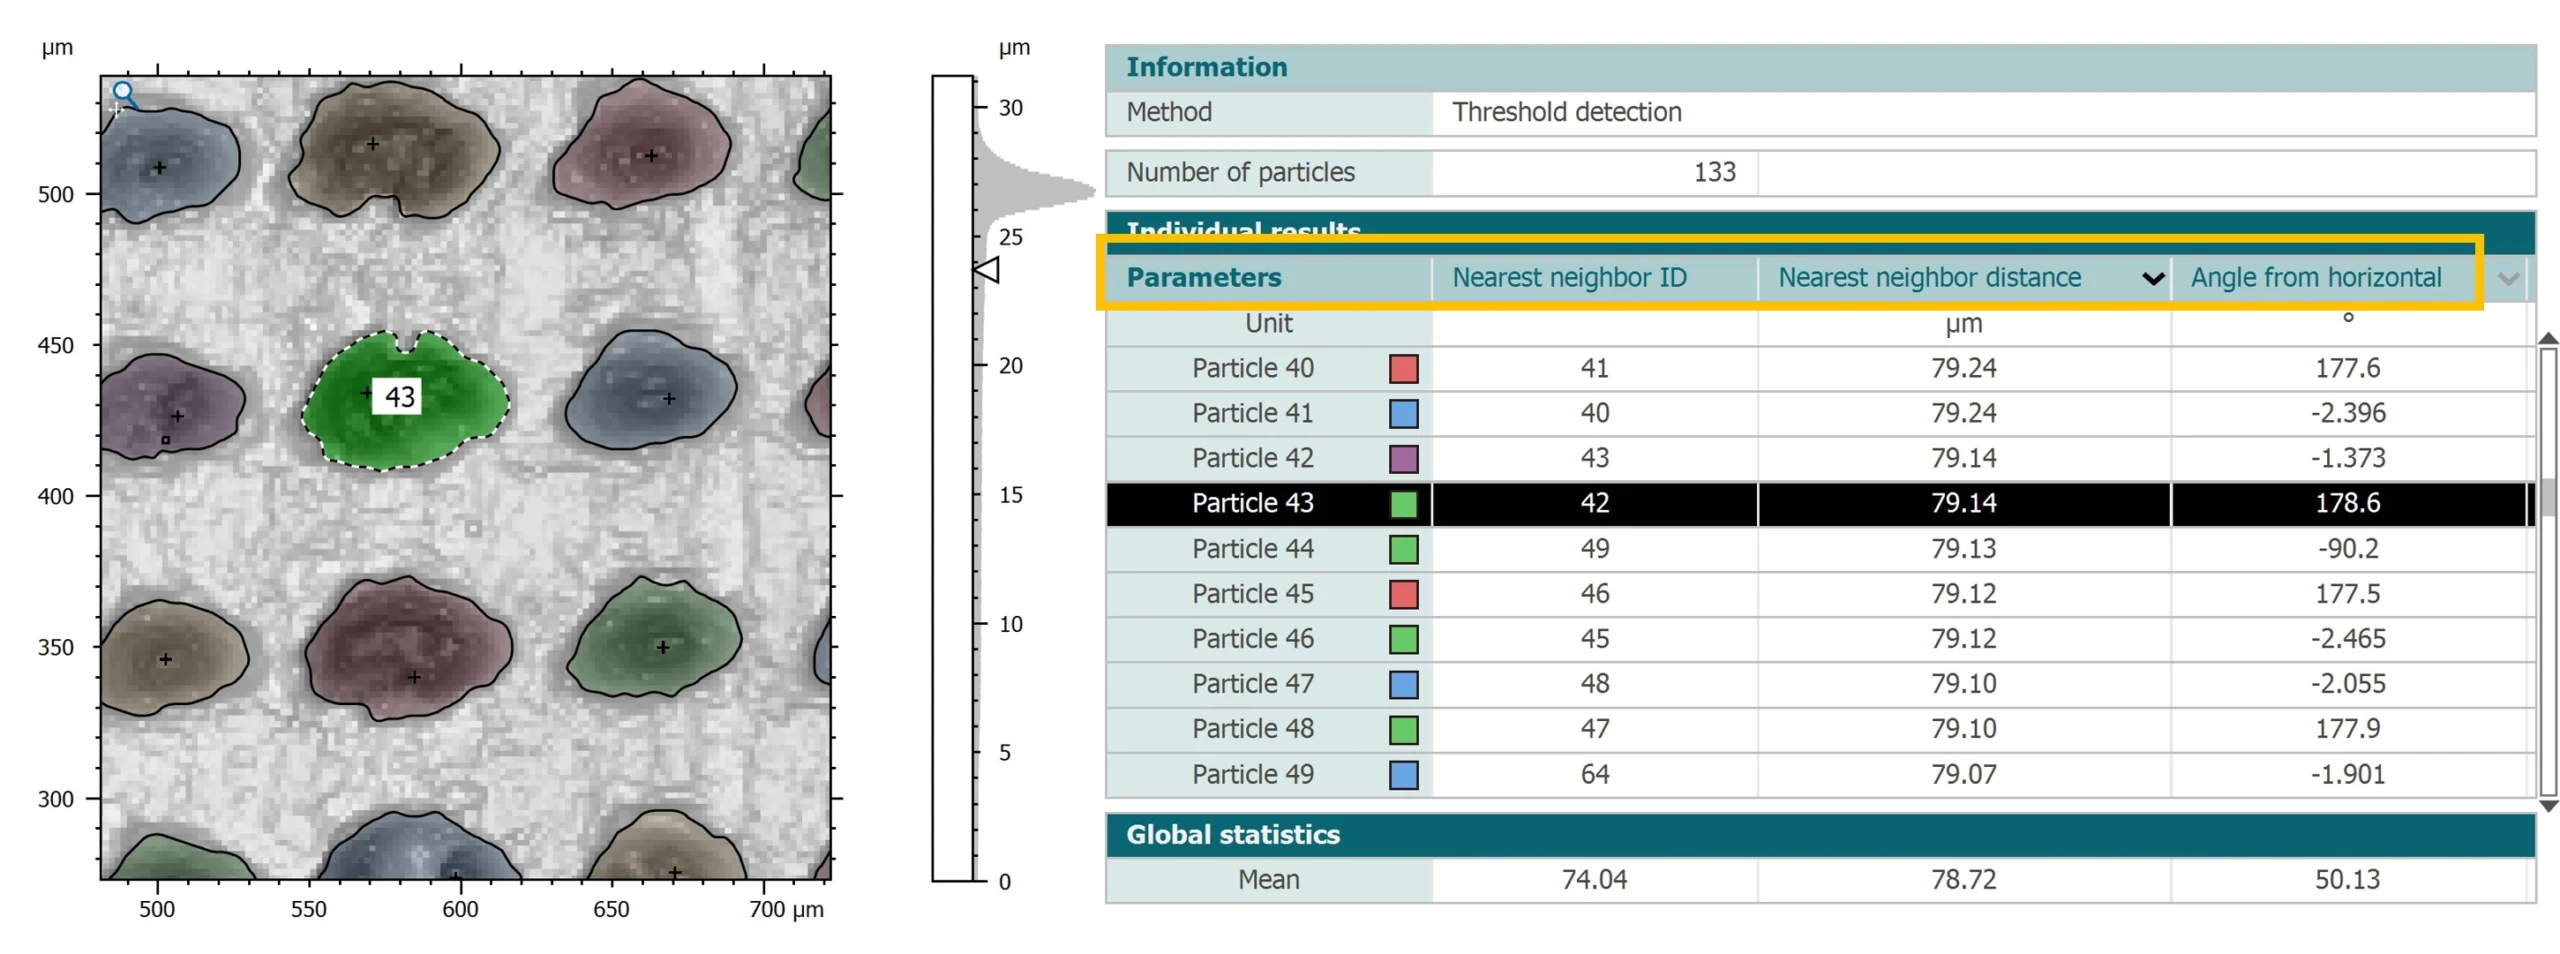
- Analyze particle proximity with three new parameters: Neighbor ID, Neighbor distance and Angle from horizontal
- Automatically identify the closest neighbor for every particle based on geometric centers in the XY plane
- Integrates seamlessly with existing workflows: sorting/filtering, classification and export
- Available with Threshold, AI segmentation, Watershed and Edge detection methods
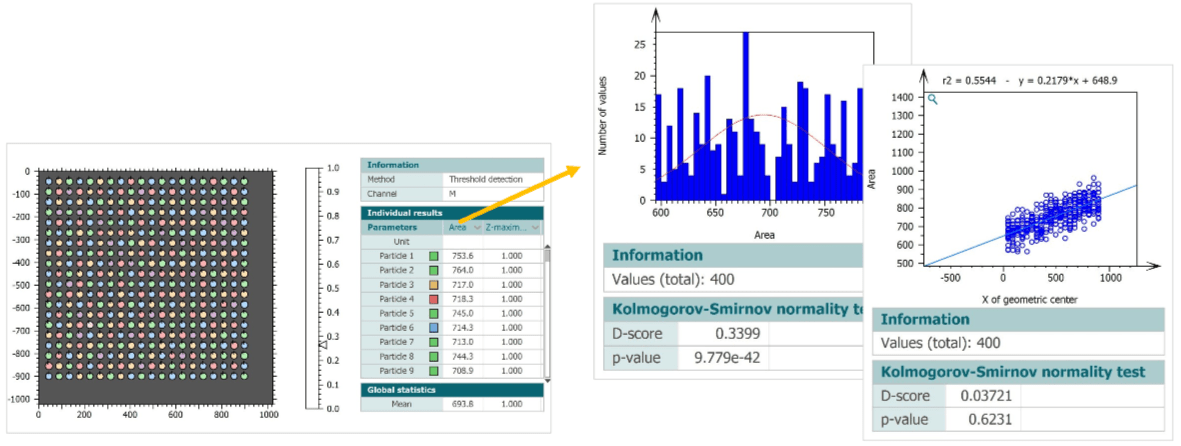
Kolmogorov-Smirnov statistical test
Strengthen your statistical analyses with the Kolmogorov-Smirnov distribution test
- Check whether measured data follow a specific distribution, including Gaussian
- Available for histograms and box plots
- Test regression residuals for normality in scatter plots
New features for profilometry
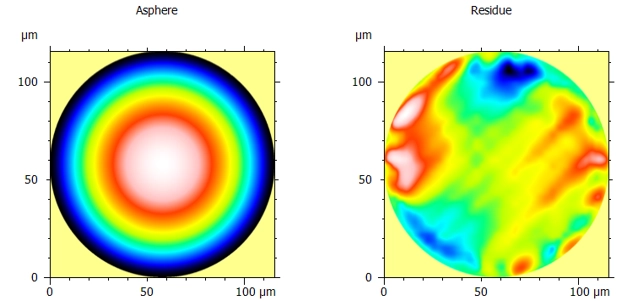
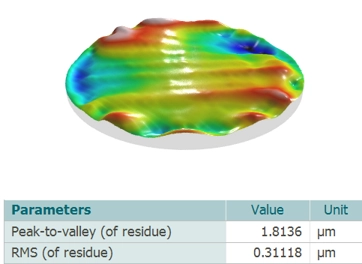
Easier asphere fitting with improved automation
Fit aspherical optical surfaces more efficiently with a streamlined workflow and an improved user experience.
- Save time with automatic lens edge detection – no manual circular area extraction required
- Characterize residual surfaces using new standardized parameters
- Work more efficiently with a redesigned interface and one-click coefficient reset
Enhanced slope distribution analysis
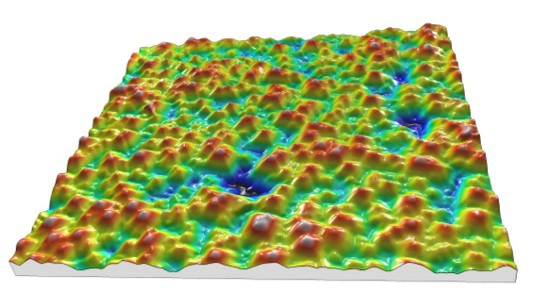
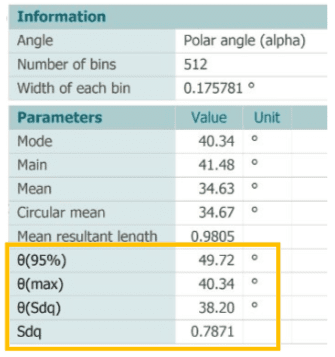
Get more from your slope analysis with new metrics, improved visualizations and enhanced usability
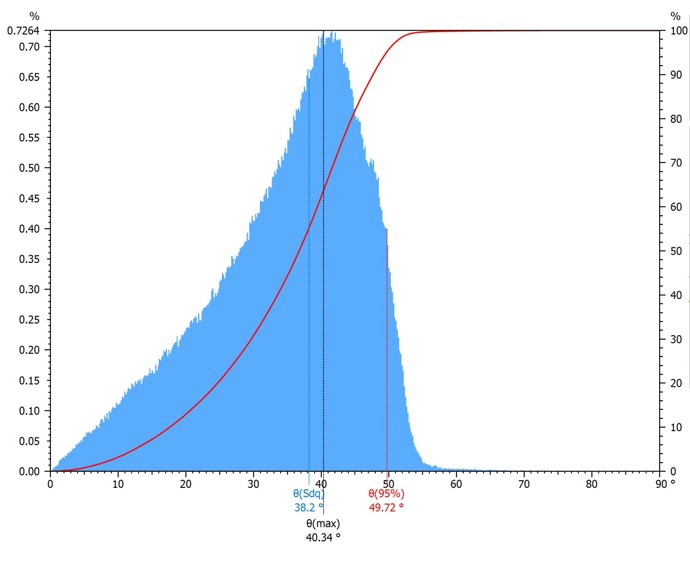
- New statistical parameters, including Sdq, associated angle, 95th percentile and standard deviation
- New cumulative plots and key angle markers for faster interpretation
- More accurate histogram peak detection through smoothing
- Histogram zoom for detailed analysis of narrow angle distributions
- Natural slope visualization in a polar graph (Z axis pointing upward)
- Clearer parameter definitions in Mountains® Help files
New features for SPM
More control over IV curve and force volume styles
Highlight the data that matters most!
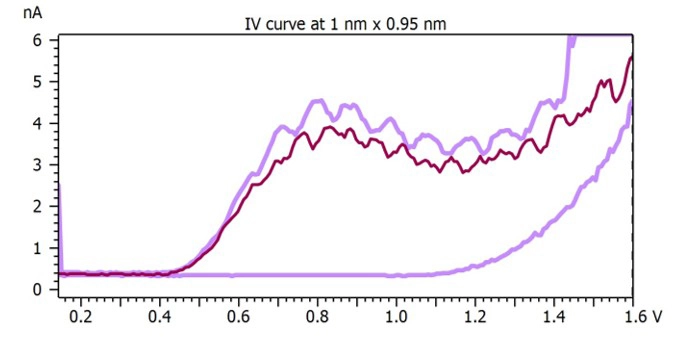
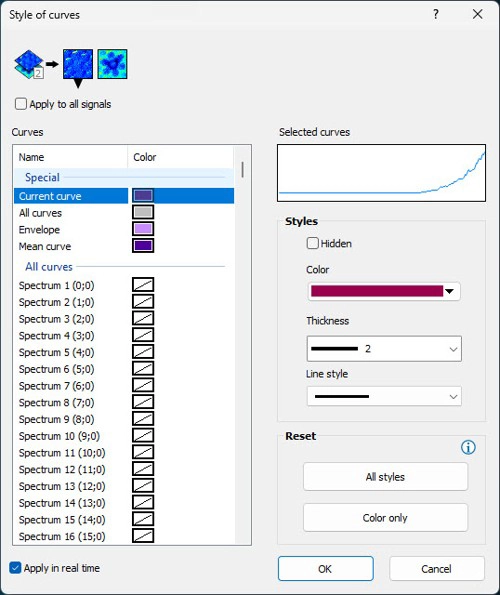
- Emphasize selected curves using the new Style of Curves option in IV Image View and Force-Volume View
- Envelope curves are displayed by default in purple
New features for spectroscopy
Enhanced spectral operator interface
See more, compare more easily and work more efficiently with redesigned spectral operator dialogs
- Visualize spectral maps alongside spectra with synchronized views for better data interpretation
- Compare source and result instantly thanks to synchronized before-and-after displays
- Navigate large datasets more comfortably with improved handling of high-volume spectral data (learn more)
- Display settings are automatically retained between sessions
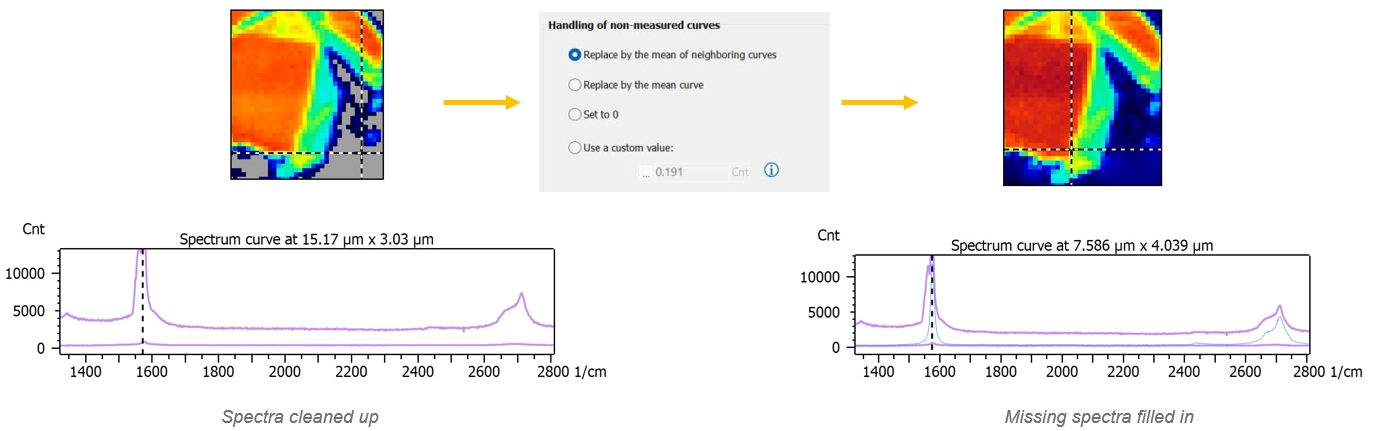
New operator to fill missing spectra
Create cleaner spectral datasets by automatically filling missing curves
- Restore complete hyperspectral images by filling gaps left by missing spectra
- Produce cleaner, more continuous visualizations, especially after data cleanup operations
- Ideal after the Clean up spectra operator, which removes outlier spectra and may leave empty regions
Mask cursors for cleaner visualization
Hide cursors when you need a cleaner view, without losing functionality
- Show or hide both spectral (W) and spatial (XY) cursors with a single click
- Keep working seamlessly: hidden cursors remain active, so keyboard navigation and synchronization continue to work
- Create cleaner visualizations for presentations, reports or printing by removing unnecessary cursor overlays
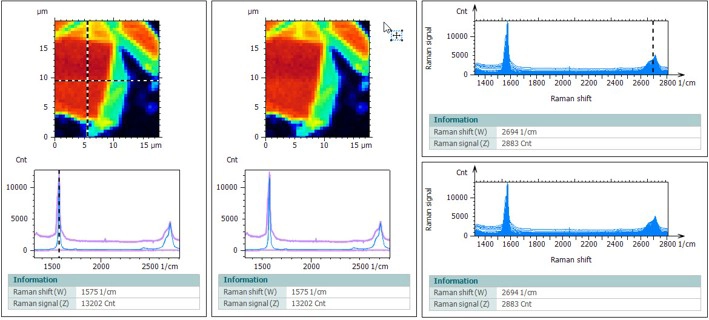
Choose to hide cursors when working with spectra and hyperspectral images for a cleaner visualization
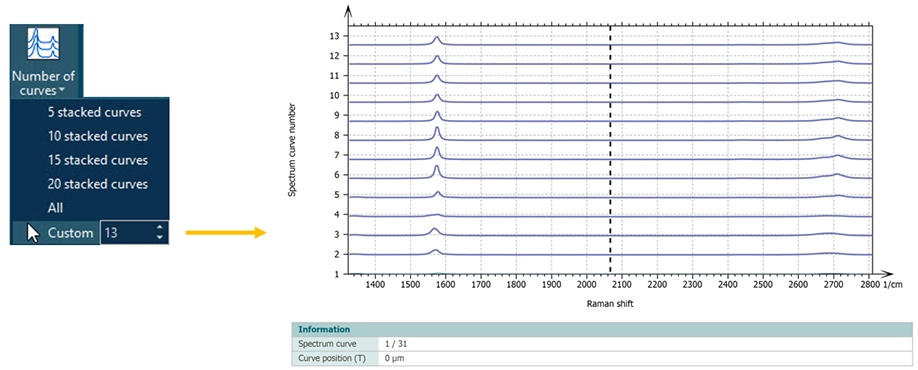
Flexible curve selection in Stack View
Control curve visibility with new selection options in Stack View
- Display all curves instantly using the new All option
- Show only the curves you need with the new Custom selection mode
Learn more & update
For a full list of the changes and bug fixes published in this release, please download the release notes available here.
Access to this latest release is included in the Mountains® Software Maintenance Plan (SMP). Please visit our Software Updates page.
To find out more about SMP options, please contact sales@digitalsurf.com or visit this page.