Digital Surf releases version 11.2 of its Mountains® software platform. Let’s take a closer look at what’s included in this new release.
- Cross-technology features
- Profilometry features
- SPM features
- Spectroscopy features
- SEM & Light microscopy features
Cross-technology features
New 3D amplification factor
- Easily compare height variations between different surfaces in 3D view
- Apply a custom amplification factor for consistent visual comparison
- Also available in the History of the current studiable and with other studiables (series, multi-channel images, etc.)
- Ensures consistent vertical scaling across datasets
- Full compatibility maintained:
- Amplification in percent of surface XY length is still available.
- For surfaces with non-metric Z or XY units, amplification is automatically expressed as % of surface XY size length.
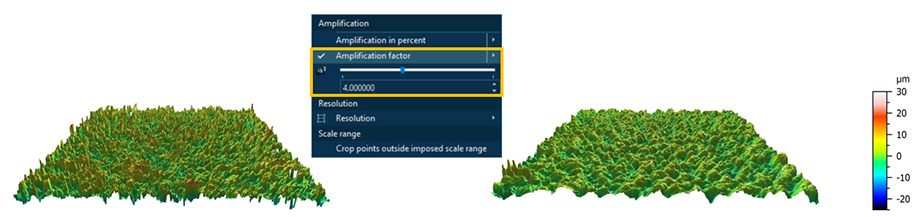
Comparing surface heights before and after treatment with consistent amplification factor
Rename Studies & Operators
- Rename Studies and Operators at any time
- Full control over displayed titles
- Clearly document processing steps
- Make workflows easier to understand
- Improve readability in History of a studiable and Workflow
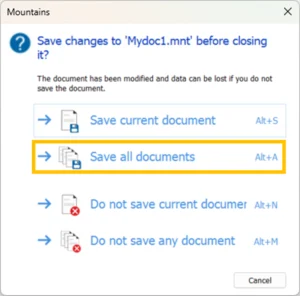
Close multiple documents: improved saving options
- Save all modified documents at once when closing multiple files or exiting the software
- Clearer confirmation dialog with visible keyboard shortcuts
- Save time when working with multiple documents
Stitching: auto-select studiables
- Clearer, more intuitive studiable selection interface
- Real-time automatic selection options:
- Use only root studiables
- Use only leaf studiables (no sub-steps)
- Select studiables with a specific operator applied (e.g., Level)
- Simplifies automation, even when the number of root studiables varies
- Reduces manual selection errors
- The filtering field and corresponding checkbox are now dynamic for real-time filtering
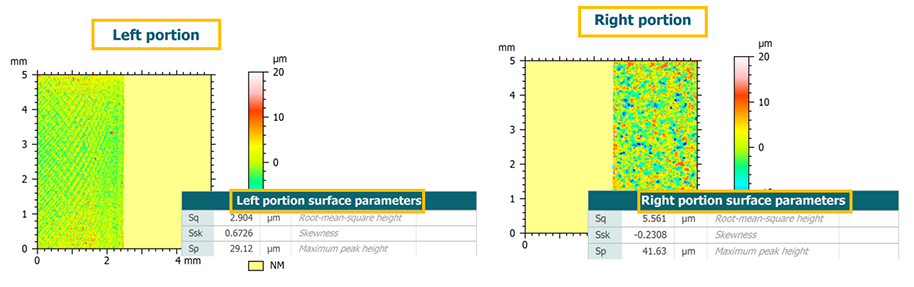
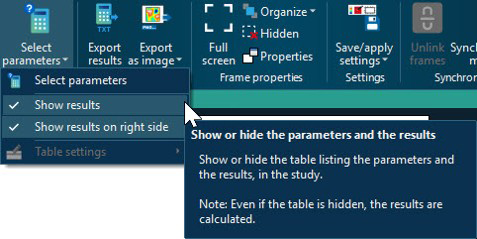
Show/hide parameters tables
- Choose to show/hide parameter tables in the Parameters table study
- Display only the filtered studiable and avoid duplicate display when using Results tables in further analysis
ActiveX improvements
For ActiveX integration users :
- Automatic synchronization of color themes between Mountains® and acquisition software
- Add-ons: studies can now break across pages (ideal for long parameter lists and detailed reports)

Add-ons now support the breaking of studies across pages
New features for Profilometry
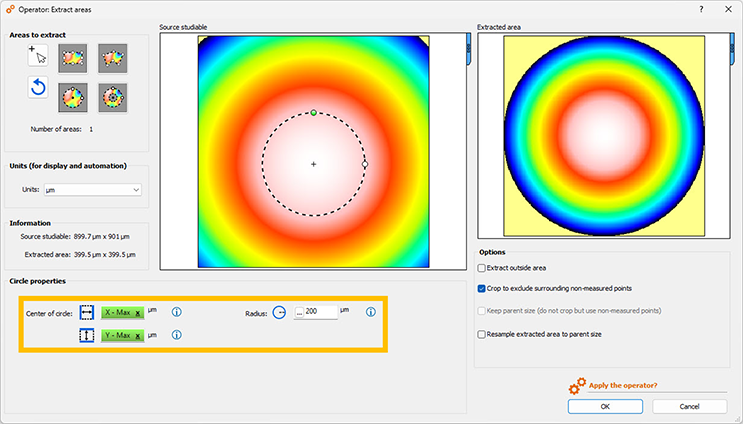
Extract Areas enhanced for Profiles/Surfaces
- Work in absolute or relative units (when using %, values can also be displayed in mm and points)
- New position controls for choosing which area to extract
- New shape in “Areas to extract” on Surfaces: Ring-shaped area
- New option: crop to exclude surrounding non-measured points
- Clearer error warnings for invalid entries
- New detailed section in Reference Guide (Help) on this operator
Result picker now available in Extract Areas
- Use Result pickers when defining area to extract
- Automatically position areas based on variable results (e.g., around a maximum peak or the center of a studiable)
- Ideal for automation and batch processing (simplifies studiable substitution)
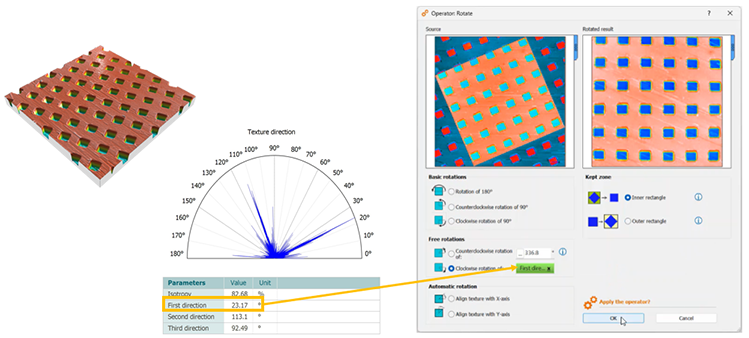
Result picker now available in Rotate the surface
- Dynamically set the rotation angle using a value derived from surface motifs or characteristic texture
- New adjustment controls:
- ↑ / ↓ arrows: 0.1° increments
- Shift + ↑ / ↓: 1° increments
- Improves repeatability and consistency
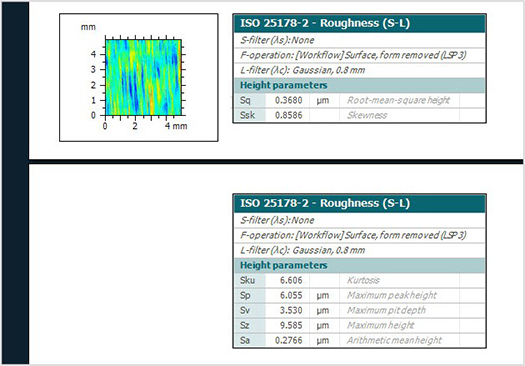
Enhanced Multi-scale filter bank
- New filtering capabilities added to Multi-scale filter bank operator (previously called Band-pass filter bank):
- Low pass (S-filter): generate series of surfaces that progressively remove fine-scale roughness to reveal larger-scale waviness components
- High pass (L-filter): generate a series of surfaces that progressively remove waviness to isolate fine-scale roughness features
- Useful for comparing surface structures across different spatial scales
- Explore your surface at every scale, not just one cut-off!
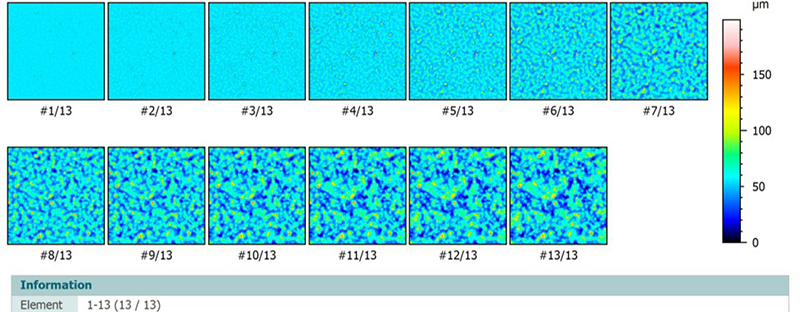
Series of surfaces generated using high-pass filter
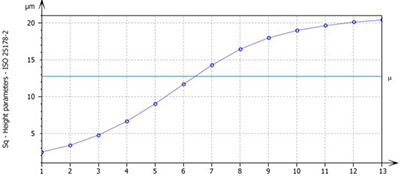
Control chart showing evolution of Sq parameter at different cut-offs
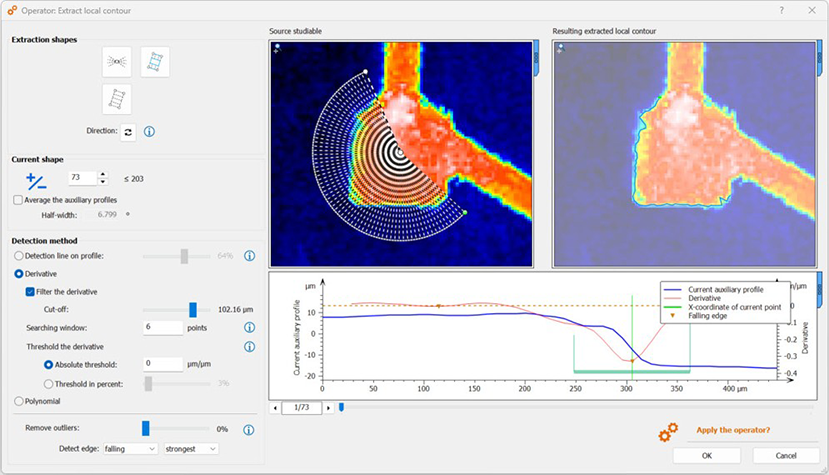
Extract local contour: improved usability
- Clearer, more readable dialog with help “infobubbles”
- Detection line now visible on profile to visualize threshold
- Derivative method: derivative units displayed for better clarity
- “Remove Outliers” method now available with polynomial detection mode
- Improved display of extracted profiles
- Edge pairs detection now easier to interpret
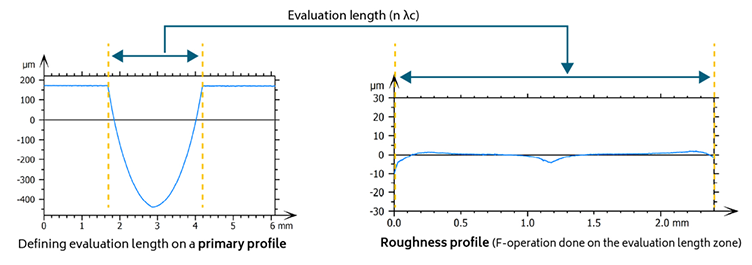
Parameter calculation workflow improvements
- The evaluation length is now applied at the very beginning of the workflow, ensuring that only the selected portion of the profile influences the calculated results
- F-operator calculations now automatically respect the selected evaluation length
- Users can now define an evaluation length directly in the parameter table for primary profiles
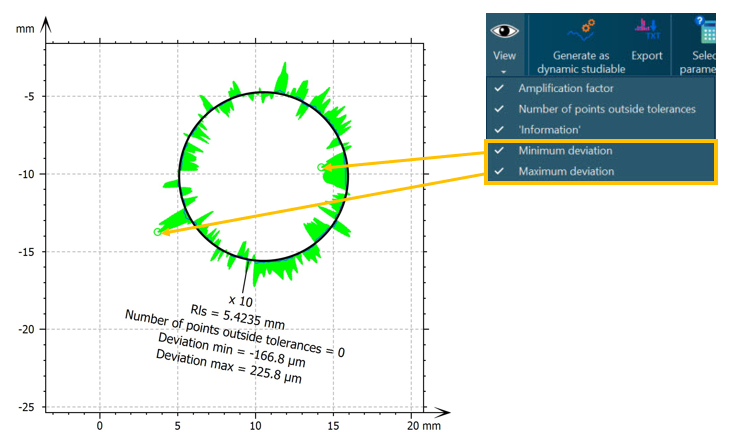
Advanced Contour: display min/max deviations
- When analyzing form errors, i.e. the deviation between the measured profile and the nominal form, users can now display minimum and maximum deviations
New features for SPM
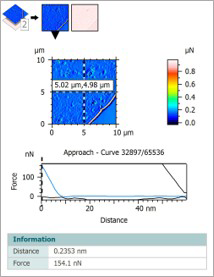
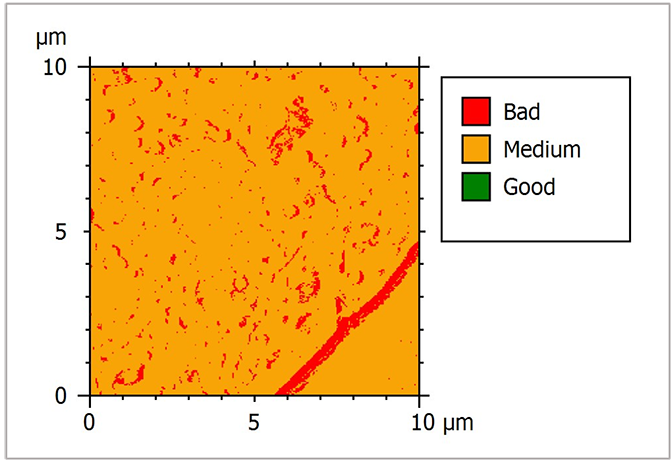
Estimate force curve quality with machine learning
- Automatically score each force curve using a pre-trained model (100,000 human-annotated curves)
- Generate a segmented quality map of Force Volume data
- Filter out low-quality curves before mechanical analysis
- Validate pre-processing and distinguish reliable vs. unreliable data
- Reduce data volume and significantly speed up calculations
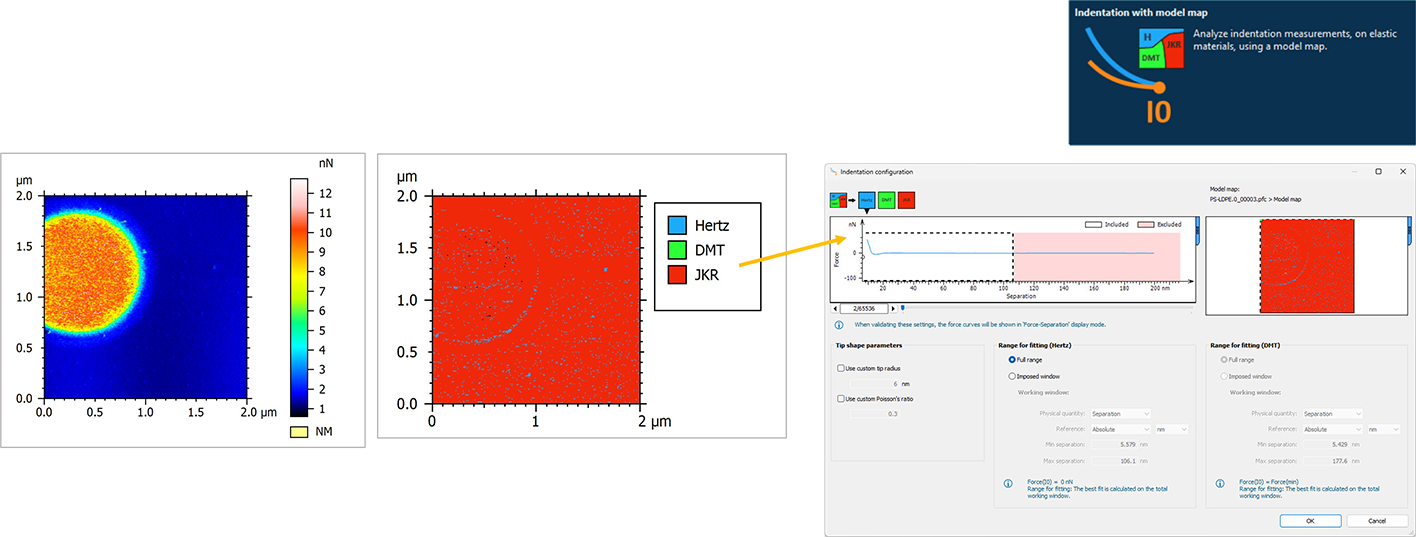
Determine best fitting model for force curves
- Guided model selection for use by both new and experienced users
- Automatically generate a model map based on Tabor coefficient & Load parameter
- Apply automatic per-curve model selection during indentation fitting
- Ensures robust, scientifically-relevant mechanical results
- Simplifies complex model decisions for faster analysis
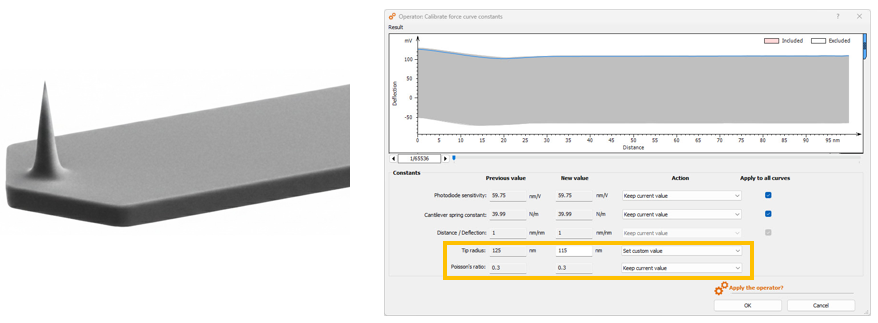
Use tip radius & Poisson’s ratio
- Tip radius and Poisson’s ratio parameters now automatically integrated for Force Curve studiables for more accurate mechanical property calculation
- New fields in Calibrate Constants to update these values
- Automatic reading of values in dedicated tools
- Option to use studiable values or enter custom values (allows more flexibility)
- Improved automation and consistency
New features for spectroscopy
Peak fitting: deferred calculations
- Choose to postpone automatic calculations for large datasets or multiple peaks
- Adjust all fitting parameters before running computations
- Avoid unnecessary recalculation when refining settings or after unintended actions
- Save time on computationally intensive analyses
- NB. Non-deferred mode remains available for quick adjustments on small datasets or individual peaks
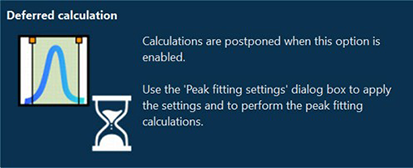
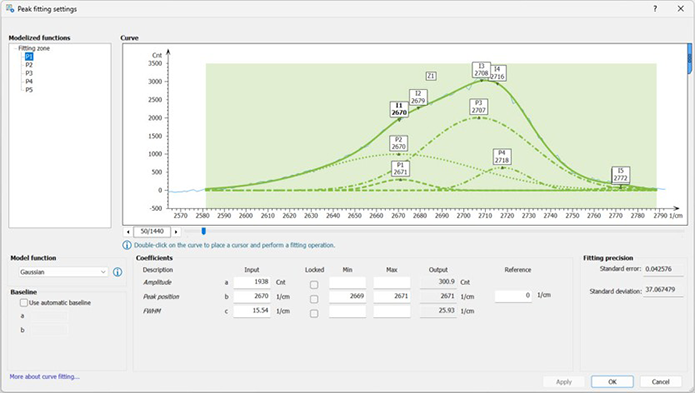
Choose to defer calculations and use “Peak fitting settings” dialog to apply settings when you’re ready
Zoom & size in Hyperspectral image view
- A clearer, more practical workspace for hyperspectral analysis:
- Default study size optimized (half-page landscape) to display two studies per screen
- New horizontal zoom in spectral view for detailed peak inspection
Other new features for spectral analysis
- Addition option in Add/Subtract Spectrum
- Perform manual subtraction when automatic subtraction is not desired
- Easier management of spectral bands (see right)
- Quick preview buttons to add, delete, or clear all bands
- Convert hyperspectral data into a series of surfaces
- Explore your data from a new perspective (e.g., in IR spectroscopy)
New features for SEM & light microscopy
New Subtract operator on images
- Subtract one image from another to highlight differences
- Manual or automatic image alignment options
- Flexible handling of negative values:
- Replace with 0
- Use absolute values
- Shift values by 128 to recenter and optimize range
- Useful for detecting changes and defects (e.g. dirt or contamination analysis on images)
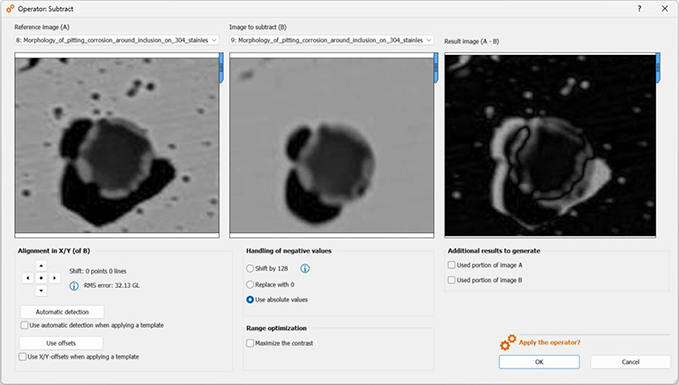
Stainless steel sample showing a complex (Al,Mn,Si)O inclusion enclosed within an (Al,Mn)O inclusion after etching with ferric chloride hexahydrate. Image subtraction highlights the corroded regions in bright contrast, enabling measurement of their surface area to monitor corrosion progression
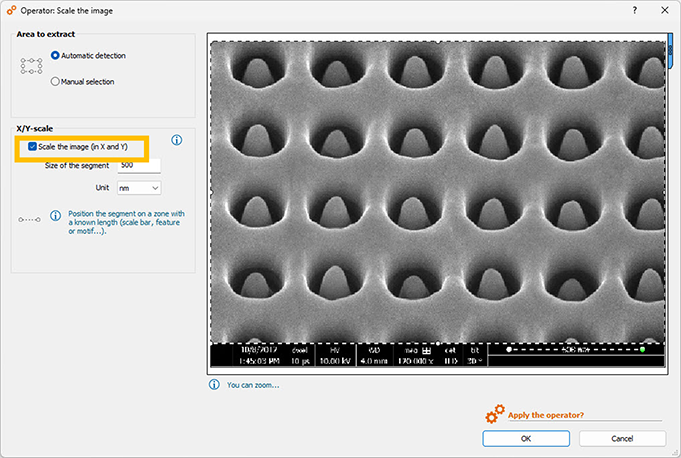
Scale the image improvements
- More robust automatic detection of data bars displayed on images
- Choose not to display the scale overlay when correct scaling is already embedded (in the image or metadata)
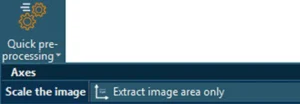
- New quick pre-processing tool: Extract image area only
Learn more & update
For a full list of the changes and bug fixes published in this release, please download the release notes available here.
Access to this latest release is included in the Mountains® Software Maintenance Plan (SMP). Please visit our Software Updates page.
To find out more about SMP options, please contact sales@digitalsurf.com or visit this page.