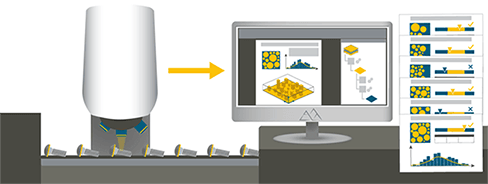
The new Mountains® 10.2 version has just been released. This latest release includes a number of new features, in particular dedicated to users working with topographic data. In the context of smarter manufacturing, many new tools contained in this version will contribute to improving automated practices in production environments. Read on to find out more.
- Cross-technology features
- Profilometry features
- SEM features
- Correlation & spectroscopy features
- SPM features
Cross-technology features
More options in template mode
What are Templates?
- Templates allow you to automate your analyses without the need to create a macro or write code.
- You can apply an analysis protocol saved in any document to one or several studiables, without having to redefine the studies and operators that make up the protocol.
What’s new in 10.2?
- Save any studiable in the Workflow when in template mode.
- Choose which operator dialog boxes to open when using templates.
- Choose to export studiables in text format.
Improved control in ActiveX mode
- In cases when Mountains® software is fully integrated into the acquisition software as a COM component via ActiveX, error messages (invalid settings etc.) are now displayed more clearly, offering more control when applying templates.
- In ActiveX mode, choose format for studiable export.
- Custom studies can be deleted using the Delete key.
- A command displays the directory defined in the File Explorer panel.
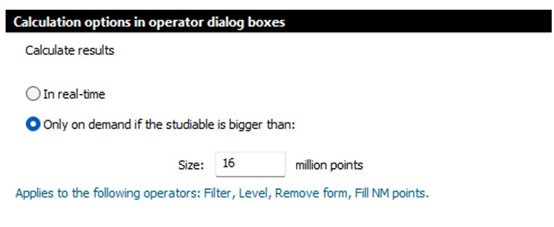
Operators now quicker and more flexible
- Operators are more responsive when opening and making adjustments, calculations have been optimized.
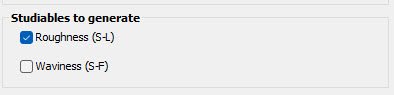
- Studiables generated by an operator can now be modified, added or removed when the operator dialog is recalled (for operators generating several studiables).
Other new features
Mountains® 10.2 includes many other new cross-technology improvements, aimed at making life easier for users. These include:
- Add Student’s t-tests and F-tests in statistical studies, with calculation of p-values.
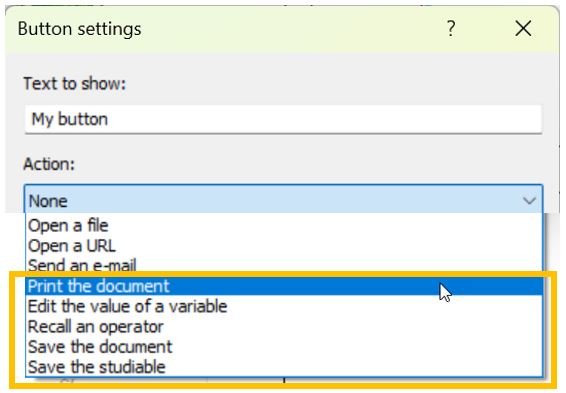
- New Button actions: Print the document, Edit variable value, Recall operator etc.
- Compact Workflow display: choose to collapse all items except those of selected studies.
- Define order of columns in Tables of results.
- Apply “Use Z-offsets” option when creating a series.
New features for profilometry
Point cloud stitching
- Assemble multiple point clouds, measured from different angles, into a single point cloud.
- Automatically detect and stitch overlaps.
- For applications including analysis of measurements made from several angles around an object, by multiple scans, with manual or automatic rotation (rotary stage or 5-axis stage).
- Concatenate point clouds (if they were measured within the same coordinate system and without positional errors).
- Best-fit optimization: assemble and adjust in the case of positional errors or if point clouds were measured with different coordinate systems.
- Stitched point clouds can be converted to Shells (freeform surfaces) for metrological analysis.
Assembly of 9 point clouds measured with different coordinate systems into a single dataset, converted into a Shell studiable.
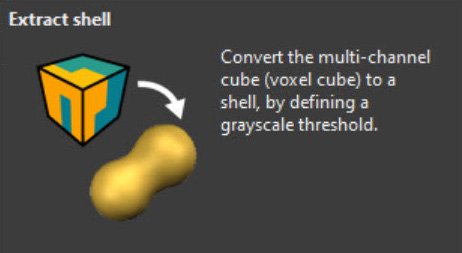
Extract shells from voxel cubes
- Extract a Shell (freeform surface), detected at a particular density threshold, from a voxel cube measured by X-ray computed tomography (XCT). NB: Max. 2 gigavoxels.
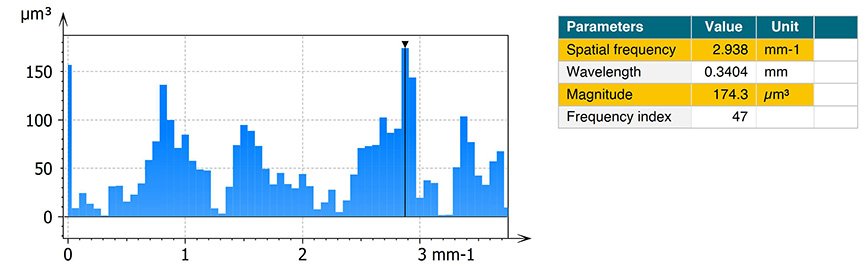
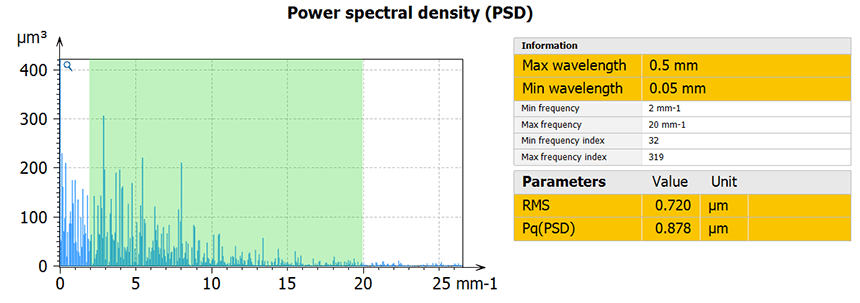
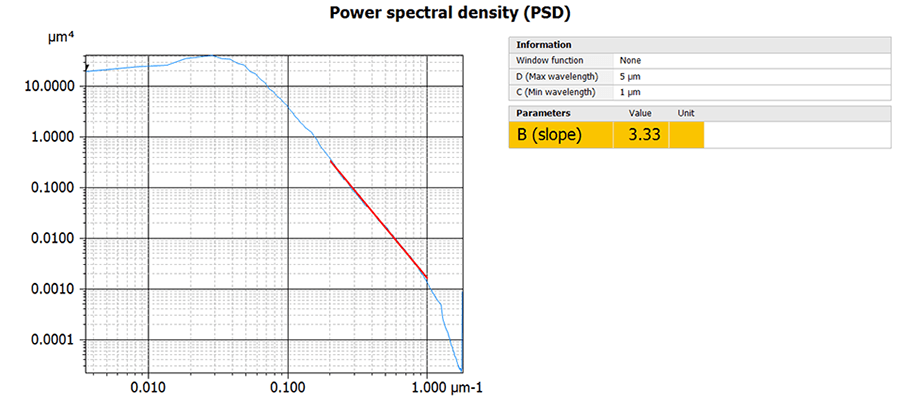
Power spectral density study
New Power spectral density (PSD) tool:
- Calculate RMS roughness on a range of frequencies.
- Display log-log graph and fit a line on its linear part, to calculate A and B parameters, according to ISO 10110-8.
More control over parameter configuration
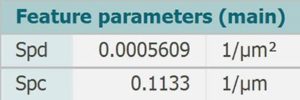
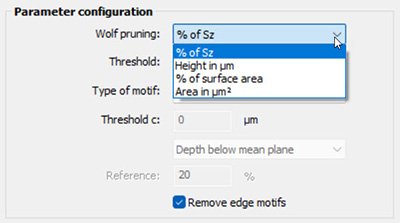
- Feature parameters (ISO 25178-2, ISO 21920-2) now have more pruning options: value of Sz, percentage of area, value of area.
- Discrimination thresholds used in the “crossing-the-line” segmentation for RSm, Rpc (ISO 21920-2) parameters can now be configured, allowing better control of how elements are detected.
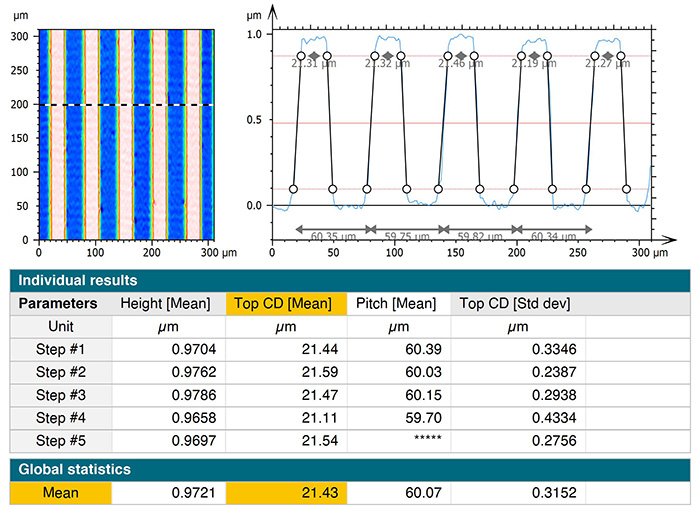
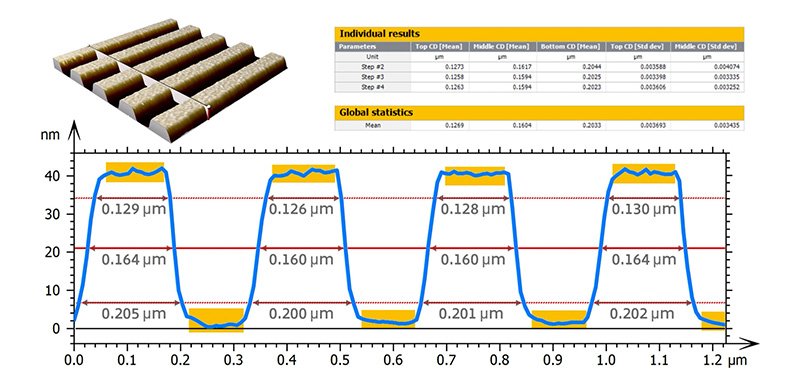
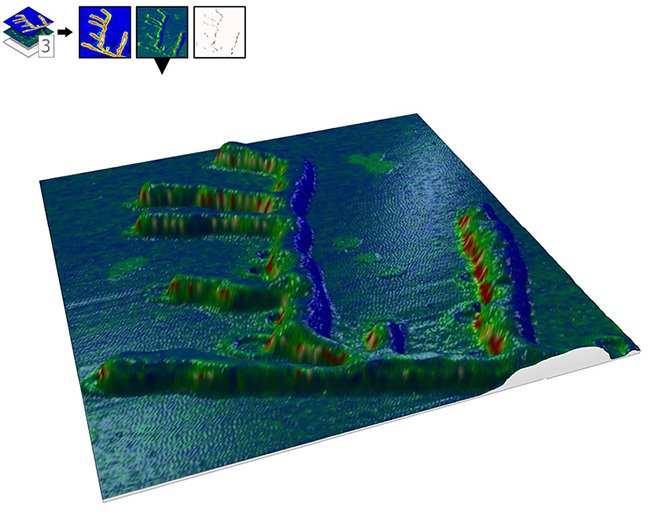
New CD and Trenches module
Calculate critical dimensions (CD) measured with profilometers in semiconductor applications etc.
- Detect peaks or trenches quickly and easily.
- Calculate parameters relative to Critical Dimension analysis: height, top/middle/bottom CD, sidewall angle, pitch, width/pitch ratio etc.
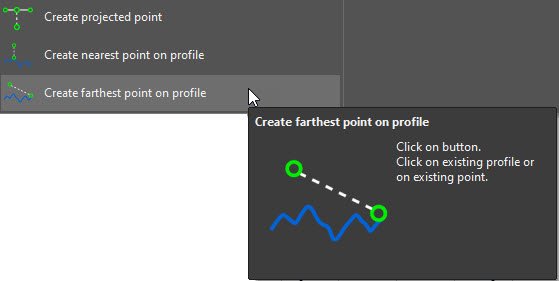
Improvements to Contour study
Many improvements to the Contour study, in particular improving repeatability.
- Create nearest or farthest points on Profile.
- Create projected point.
- Create segment from whole profile.
- Create ellipse from profile/closed profile.
- Display amplification factor on residues.
- Show direction of segment created in contact with the profile.
- Select which background to show beneath profile.
- etc.
Other improvements
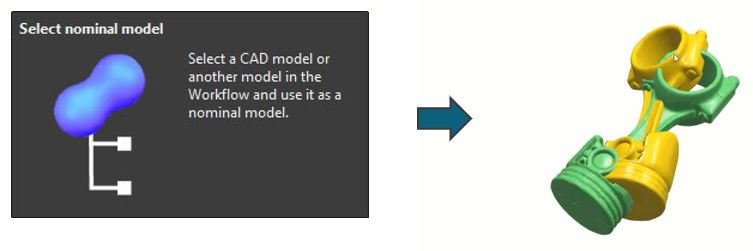
- Shell CAD compare: The nominal model can now be selected from the workflow, in addition to loading a CAD file. It allows the user to select a modified Shell, or to compare two shells originating from two different measurements.
- Rotation of series: a series of surfaces can now be rotated simultaneously using the Rotation operator. When using the option Align texture to X (or Y) axis, each surface is rotated by its own angle.
- Improved Rk/Sk graphical study: Rpkx/Svkx and Rvkx/Svkx are now available in the parameter table.
- Bandpass filter operator: the lower and upper cut-off limits can now be specified manually, allowing better comparison of bands on surfaces of different sizes.
New features for SEM
Characterize line edge roughness (LER)
- Calculate line edge roughness (LER) and line width roughness (LWR) parameters on the edges of bands detected in SEM images.
- Detect bands using thresholding, the Canny method (to compensate asymmetrical charging effect on edges) or detect bands between trims (when grayscale levels vary little).
- Process large quantities of data using Mountains® automation tools.
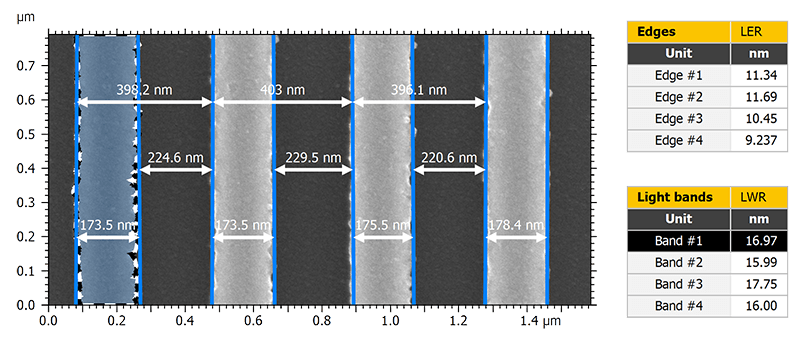
New Line edge roughness tool for SEM image analysis
Improvements for volume electron microscopy
- Extract a sub-area when loading image stacks, in order to focus your analysis on a specific area of interest and reduce consumed resources.
- New Segment the cube operator allows you to segment data into several classes according to voxel intensity value.
- Improved 3D rendering of cubes (volumetric, iso surface, maximum intensity projection).
- Cubes can be now saved in Mountains® .sur format.
Volumetric rendering of cube (reconstructed from a series of 100 FIB-SEM images of a plasmonic nanoantenna)
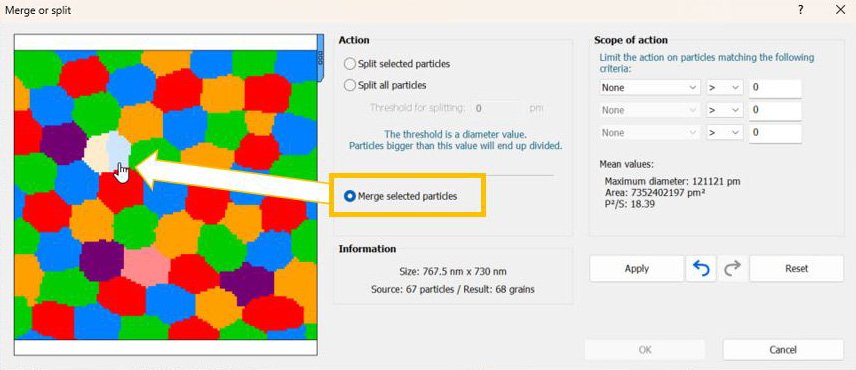
Take your SEM particle analysis further
- In watershed or edge detection modes:
- Refine particle detection by merging or splitting particles manually or semi-automatically depending on chosen criteria.
- Exclude a background using intensity threshold.
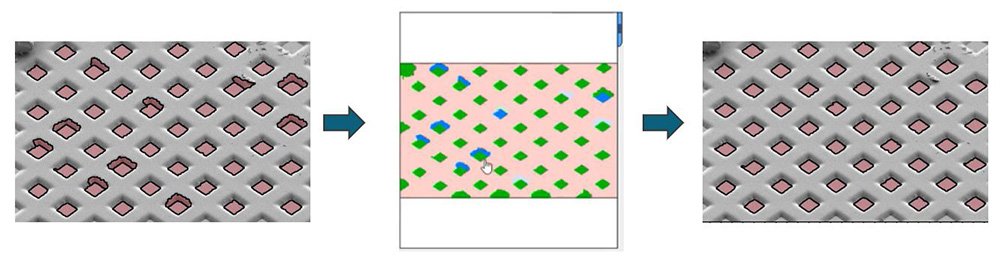
Merge particles when using Edge detection mode.
New features for correlation & spectroscopy
Better W-axis (spectral axis) management
- Choose to work with increasing/decreasing spectral axis (W-axis) depending on the type of spectral data you’re analyzing.
- Display spectral data (spectrum, series and hyperspectral image) with two different units by adding the secondary axis.
- Particularly useful for cathodoluminescence or in the case of the Raman spectra with the photoluminescence/fluorescence bands.
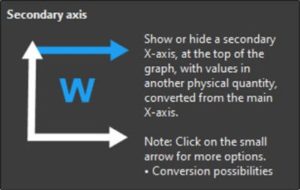
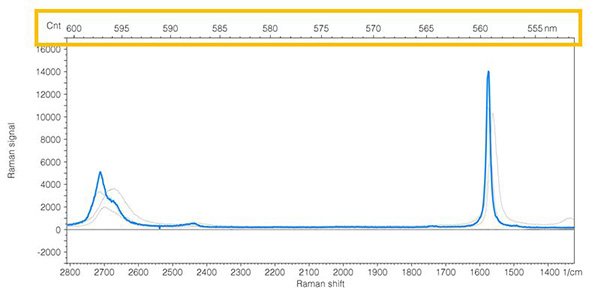
Choose to add a secondary axis to display values in different units
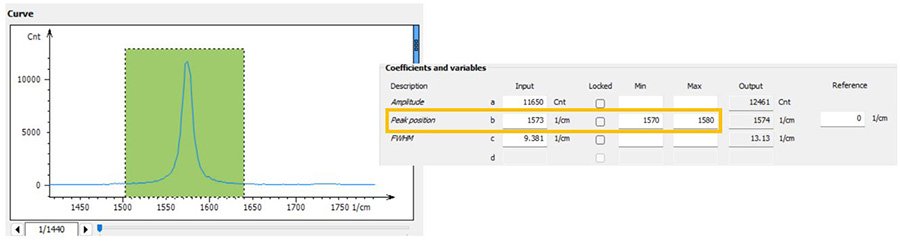
Peak fitting: new settings
- Set min-max constraints to improve precision of Peak Fitting.
Improvements for 3D spectral imaging
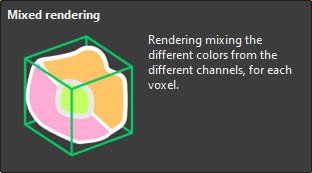
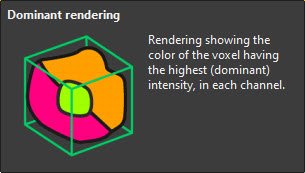
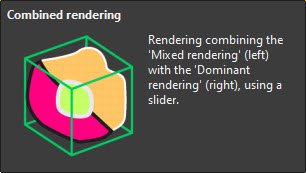
- Improved 3D rendering of multi-channel EDS cubes (mixed, combined, dominant).
New features for SPM
Critical dimension metrology with AFM
Calculate critical dimensions in semiconductor fabrication processes.
- Detect peaks or trenches quickly and easily.
- Calculate parameters relative to Critical Dimension analysis: height, top/middle/bottom CD, sidewall angle, pitch, width/pitch ratio etc.
- Display surface geometry and values for each profile or for each pattern.
- Quality assurance: statistically evaluate each detected pattern.
- Refine option: make your statistical analysis more meaningful by choosing to exclude certain profiles with aberrant values.
Efficiently characterize critical dimensions in AFM measurements
New options in particle & pore analysis
- In watershed or edge detection modes:
- Refine particle detection by merging or splitting particles manually or semi-automatically depending on chosen criteria.
- Exclude a background using intensity threshold.
Enhanced nanoindentation analysis
- New options for indentation analysis on force curves events serve applications such as analysis of complex compounds (virology, biology, multilayer compounds).
- New Correct the segments operator: correct measurement offsets in certain Bruker .spm or JPK files. Segments are corrected so that the approach/withdrawal limit is located on the Peak Force value. This significantly improves the quality and accuracy of indentation analyses.
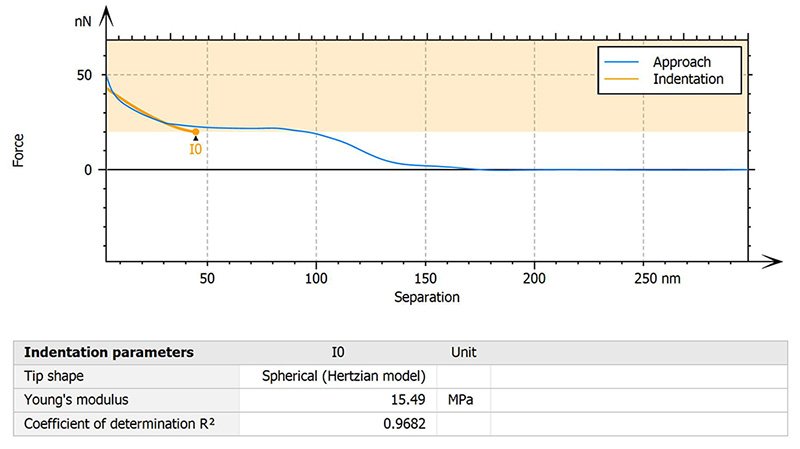
New Correct the segments operator
Learn more & update
Check the release notes for full details of the v10.2 release.
Access to this latest release is included in the Mountains® Software Maintenance Plan (SMP). Please visit our Software Updates page.
To find out more about SMP options, please contact sales@digitalsurf.com or visit this page.