Many fields of research today rely on the measurement and analysis of fibers in order to further the understanding of materials or guarantee quality during manufacturing. The Scanning Electron Microscope (SEM) has become the tool of choice for performing this task. The Mountains® software Fiber Analysis module is a fresh new addition to the extensive toolkit already available to those studying SEM images and other data. As Christophe Mignot, Digital Surf CEO, explains, in a single click, users can now access a wide set of parameters for fiber quantification and benefit from all the standard core features that have made Mountains® software so popular over the years.
Fiber analysis: data types & applications
The new Mountains® Fiber Analysis module lets users quantify individual fibers whether they are separated, touching or even overlapping. All kinds of microscopy images can be analyzed, in particular SEM images (SE & BSE modes) and optical microscopy images. Dedicated detection tools are available for each image type.
- Example applications of fiber analysis include the investigation of:
- Electrospun nano-fibers
- Cellulose and other organic fibers (gelatin, muscle)
- Synthetic fibers (such as Kevlar, polyethylene, glass) and composite materials
- Fibers from crime scenes (in forensics)
- Non-woven fibers (in filters for example)
- Mineral fibers, like asbestos.
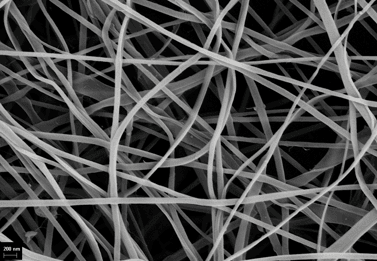
Above. Electrospun chitosan fibers imaged by a scanning electron microscope.
Attribution 2.0 Generic (CC BY 2.0): msaustero, www.flickr.com/photos/29197937@N08/5039329442
How are fiber measurements calculated?
The fiber analysis process starts with the binarization of the image. Several detection methods are available depending on the nature of the image:
- light fibers on a dark background
- dark fibers on a light background
- SEM-SE fibers with a dark center and light edges
- SEM-BSE fibers (gray on gray).
The binary image is then automatically segmented into fiber segments and interstices (spaces between fibers).
Fibers in SEM images are difficult to detect and specific, original algorithms dedicated to both SE and BSE modes have been developed by Digital Surf in Mountains® 9.3.
Although binarization is performed automatically by the software, each of the above methods can be manually controlled and adjusted by the user.
What kind of analysis can be performed?
With just one click of a button, Mountains® software automatically carries out a thorough analysis sequence of fiber morphology and displays:
- a histogram of fiber diameters
- a table of parameters for individual fibers and interstices including:
- fiber diameter (mean, min, max, standard deviation)
- average fiber direction (or fiber orientation)
- interstice diameter (for filtering applications, this allows users to calculate the maximum size of a particle that can pass through the mesh).
A really nice touch to the new tool is that the table of parameters is interactive so, by clicking on a fiber segment or interstice in the image, users can actually jump to the corresponding row in the table, and vice versa.
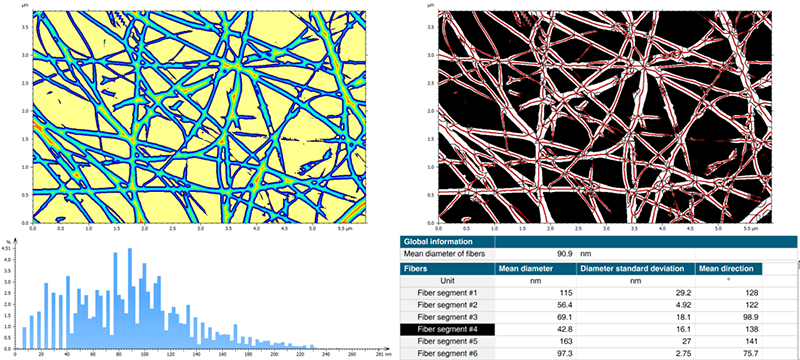
Above. Fiber Analysis of electrospun fiber image in Mountains® 9.3: distance map (top left), segmentation image showing ridges (top right), histogram of fiber diameters (bottom left) & interactive parameters table (bottom right).
Ready to try fiber analysis on your data?
How can analysis data be displayed?
Various display options are available for your data depending on final presentation requirements. If necessary, the various calculation steps can be displayed:
- raw image
- binarized image
- distance map (simulated fiber topography used to calculate fiber diameter)
- segmented image showing fiber segments and ridges of the distance map
As far as analysis results are concerned, the following display options are available:
- a diameter image
- a directional image of fibers
In these two cases, fiber diameter/direction is represented using color. The color scale used for displaying fiber direction is a circular scale optimized for viewing orientation.
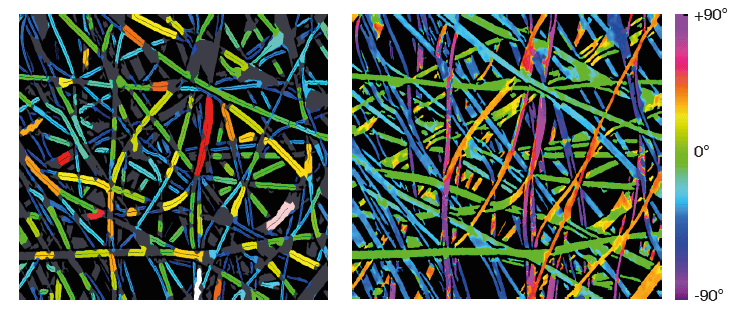
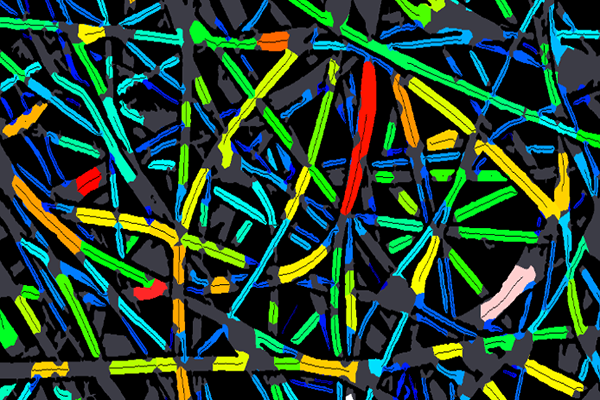
Above left. Diameter map of imaged fibers (gray areas are excluded from calculations). Right. Direction map of fibres with circular color-scale.
Fiber analysis, Mountains®-style
Once you’ve performed fiber analysis with Mountains® software, you don’t have to stop there!
As usual, industry’s favorite analysis software provides users with an array of tools for exporting, presenting and automating. Fiber analysis images can be exported in several formats for publications and reports. Numerical results can be exported to Excel at the click of a button. As ever, the Mountains® document layout can be fully customized and converted to PDF format for further sharing. Automation features are accessible for users batch processing images of fibers.
Finally, Mountains® 9.3 also includes full help files explaining new Fiber Analysis tools in detail.
How can I access new tools for fiber analysis?
The Fiber Analysis module is available as an option with MountainsSEM® Color and MountainsSEM® Expert. It is included in MountainsSEM® Premium and MountainsLab® Premium packages. The Fiber Analysis module is only compatible with version 9.3 onwards. This version is freely available to users with an active Software Maintenance Plan (SMP). If you don’t have an active SMP, please get in touch to arrange an update by emailing sales@digitalsurf.com.
If your Mountains®-based product is supplied by an instrument manufacturer, please contact them to check if the module is listed in their catalogue.
Current and new users alike may try out fiber analysis for free by downloading the Mountains® 10 software Free Trial.
What a deeper dive? Watch our webinar 👇
Webinars