


Optical surface measurements sometimes contain isolated spikes or areas where no height could be measured. Analysis software provides tools to remove outliers and fill-in non-measured points, often producing a much cleaner-looking surface. But how can we tell whether these corrections improve the measurement or remove information that matters? François Blateyron, Digital Surf’s senior surface metrology expert, explains how to make informed choices before calculating surface texture parameters.

The map is not the territory
A measured topography represents a surface as seen through an instrument. We never actually access the real surface. The measurement principle, probe or objective, sampling interval and acquisition settings determine which details are captured and how faithfully they are reproduced.
Different configurations may therefore produce different views of the same surface. Thus the difficulty in comparing several measurements done by different instruments.
Some features may be too small to resolve, too steep to access or too difficult to detect reliably. Noise adds height variations, measurement artifacts introduce false features and unsuccessful measurements leave non-measured points. What appears on screen reflects both the surface and the limitations of the measurement process.
Before calculating parameters, we must therefore ask: which features really belong to the surface, and which were introduced by the measurement?
Stability, or the art of repetition
Acquiring several measurements at the same location and combining them point by point can improve the resulting topography, provided the surface remains unchanged and the datasets are correctly aligned.
The averaging process reduces random noise. A pointwise median is less sensitive to occasional extreme values, such as outliers appearing in only part of the acquisition.
Repetition cannot eliminate systematic errors or reveal details beyond the instrument’s capabilities. Misalignment and drift can blur genuine features, while non-measured regions appearing on all measured surfaces will remain unknown. Counting how many valid measurements contribute to each point is a way to assess the quality of the acquisition. Locating areas where the highest variations occur can reveal unstable regions.
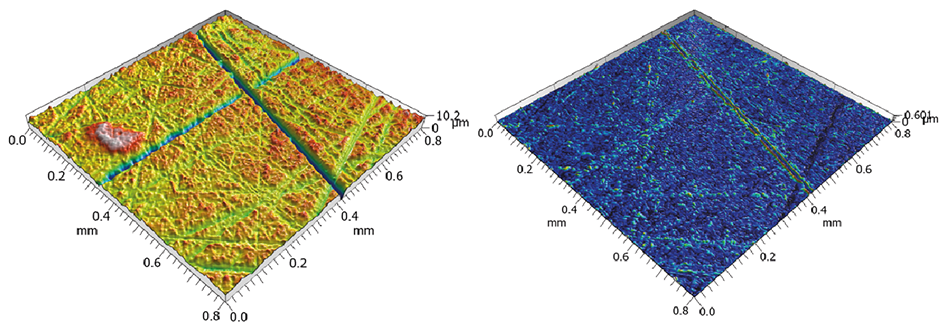
Above. Example of 10 areal measurements, done at the same place, in a short period of time. The left image shows the mean surface; the right image shows the standard deviation, revealing instabilities during repetitions, mainly located around grooves where the instrument struggles to obtain reliable measurements. The variability represents 6% of the surface amplitude.
To correct or not to correct
Leaving data untouched may seem the safest choice, yet retaining confirmed measurement artifacts can distort the analysis. A few spurious spikes (outliers) may dominate height parameters or disturb leveling and filtering. Removing them is justified when they have been reliably identified as errors. An unusual height alone, however, does not always prove that a point is incorrect: a sharp peak or deep pit may sometimes be real.
Non-measured points require a different form of judgment. Interpolating a small, isolated gap is usually reasonable when the surrounding topography is continuous and sufficiently sampled. But filling a large region is more speculative, especially across a groove, pore or edge. Missing points often occur where the instrument struggles, so neighboring heights may provide a poor indication of what lies inside the gap. Interpolation produces estimates, not additional measurements. And interpolated regions are smooth and less complex than their surroundings.
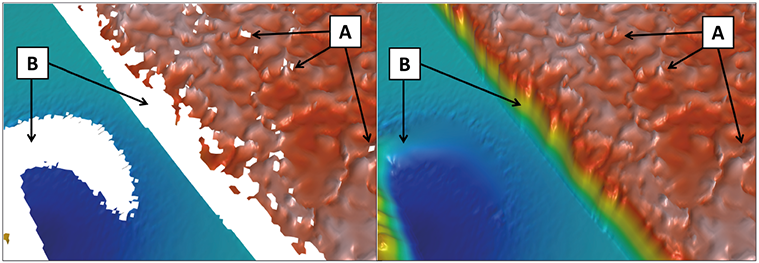
Above. Filling in non-measured points can be useful, especially with individual points or small regions (case A), or may generate smooth regions (case B) where surface complexity decreases. Impact on parameters will be almost invisible with case A regions, but may be significant in B regions.
Leaving non-measured points untouched on a surface is sometimes a sound decision as they will not be taken into account in calculations, contrary to interpolated points that will contribute to the parameter results.
Improving data, preserving information
Correction should therefore depend on the defect, its spatial extent and the intended analysis. Compare the topography and relevant parameters before and after processing: excessive smoothing may erase details that matter to the surface’s function. Preserve the original data and document the correction settings.
Where substantial information is missing, a new acquisition with a more suitable configuration may be necessary. But on the other hand, calculating surface texture parameter on a surface affected by many outliers is for sure a mistake, especially with some parameters that are more sensitive or unstable.
The golden rule? A cleaner-looking surface is only useful if it supports a more faithful analysis.
Author : François Blateyron
Resources :
Preprocessing surfaces: www.youtube.com/watch?v=kT6kjpbUP48
Filtration techniques, section 12: guide.digitalsurf.com/en/guide-filtration-techniques.html
Scaling laws of mean and uncertainty in 3D surface texture measurements: iopscience.iop.org/article/10.1088/2051-672X/ae43db
ISO 16610-30:2015, Geometrical product specifications (GPS) — Filtration Part 30: Robust profile filters: Basic concepts