Particle analysis is used in research and industry across many fields ranging from quality control of structured materials (metal, alloys, etc.) to characterization of nano-structure assemblies. Data is typically collected using profilometry or microscopy, in particular scanning probe microscopy (SPM) including atomic force microscopy (AFM).
Mountains® analysis software provides several feature detection methods, a range of graphical representations, classification and statistical tools for performing particle analysis, pore analysis or grain analysis. Product manager for SPM applications at Digital Surf, Mathieu Cognard, explains more.

Preparing for detection
The goal of particle analysis is to quantify any featured shape with defined boundaries. However, success starts with a “human” touch: knowing your sample. Understanding whether you are looking for pores, particles or a “skeleton” is primordial for choosing the right detection method.
Technically, leveling the surface is often non-negotiable when dealing with topographies. For instance, a flat, horizontal background is required for Threshold detection to avoid false readings. Filtering the surface and removing the noise beforehand may be essential to ensure your statistics are clean.
Tools and workflow
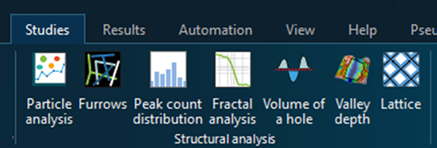
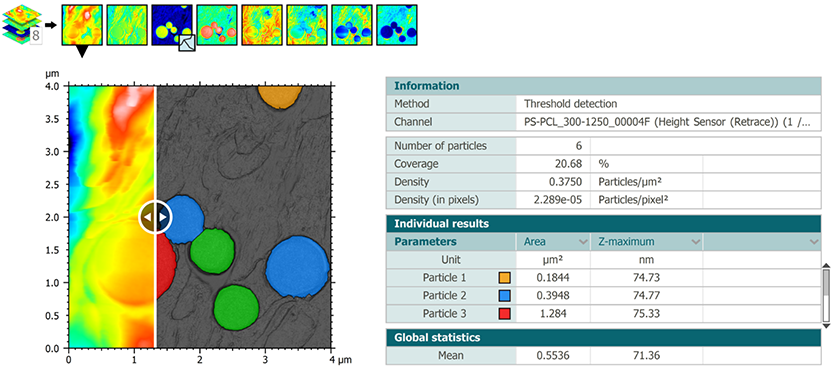
When your surface or image is active in your document, you’ll find the Particle Analysis tools in the Studies tab. Clicking the icon instantly generates a new Study in your document.
By default, the Individual results and Global statistics tables appear below the image. However, they can also be displayed to the right of the panel to enhance visualization. Just right-click on the table and select “Show results on the right side”. To save this setting as default, you can press Alt+S. Press F11 for full screen-mode.
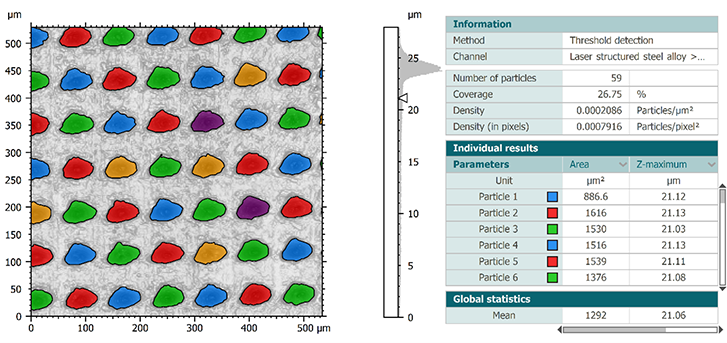
Above. View of the Particle analysis study
Learn how to perform these analyses in our particle analysis webinar series:
Particle detection
Threshold detection
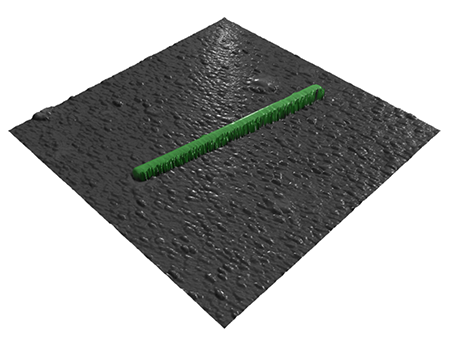
This is a fast and efficient method for detecting particles or pores that stand out clearly on a flat background, using one or two thresholds. Surface roughness must be smaller than the height of the particles (or smaller than the depth of the pores).
Watershed detection
Detect contiguous dale or hills motifs using watershed segmentation as defined in ISO25178-2 and fully segment the surface. The algorithm calculates watersheds that divide or partition hill or dale motifs and locates their peaks and pits. Pre-processing filters and pruning criteria allow you to reduce noise and eliminate insignificant motifs by merging them into larger ones.
Edge detection
Detect features on an uneven background, using watershed segmentation after the application of an edge detection filter. This method can also be used if the features are connected or not clearly separated. It also works for detecting grain boundaries of polished metal or ceramic surfaces.
AI-driven segmentation
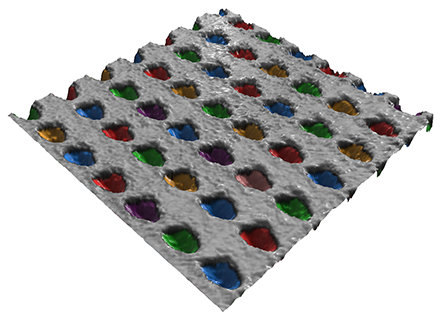
For complex samples where traditional algorithms might struggle, AI segmentation offers a powerful, automated alternative. Unlike methods that rely on manual height settings or geometric assumptions, this approach uses trained models to autonomously recognize and isolate features directly from the image or topography.
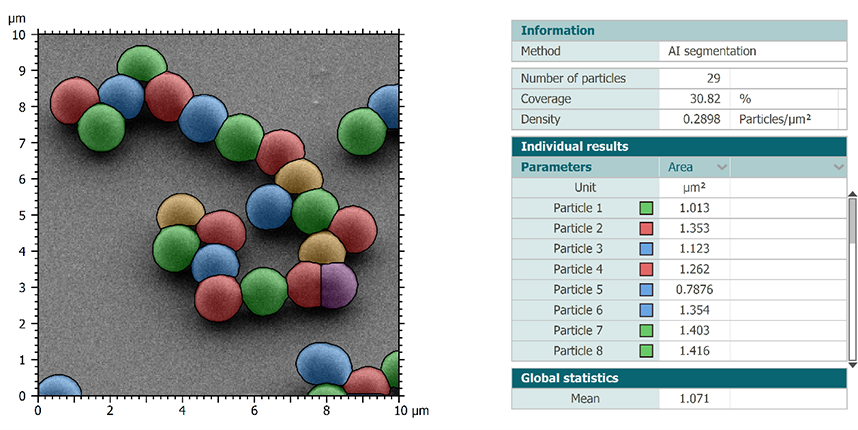
As seen in the example above, AI-based segmentation can precisely distinguish individual particles even when they are tightly packed or overlapping and instantly generate a comprehensive data set. It’s an ideal solution for high-throughput workflows where you need consistent, “human-like” recognition with the speed of a machine.
See AI-based particle analysis in action
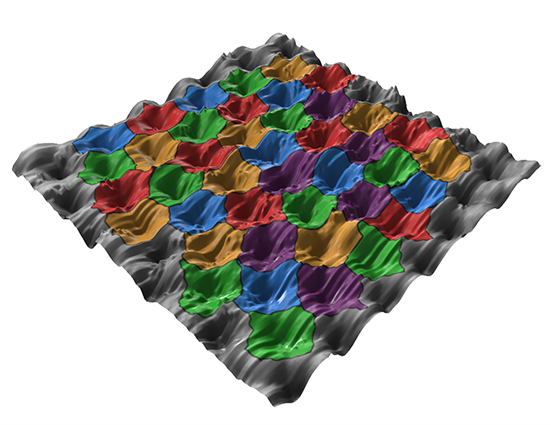
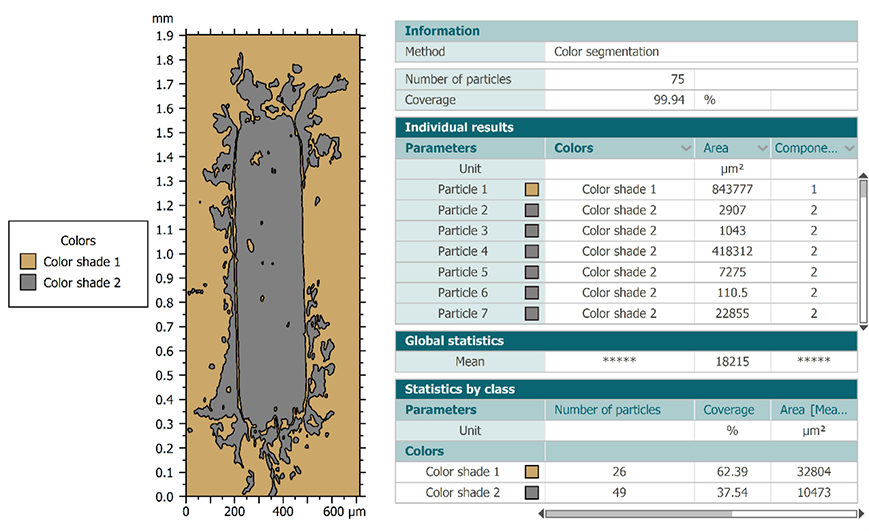
Color-based segmentation
When your features are distinguished by their visual properties rather than just their height, Color segmentation is the ideal approach. This method allows you to classify particles or regions based on specific color shades across the image. As shown in the example, the software can automatically group features and calculate their respective surface coverage. It is an incredibly effective tool for analyzing multi-material surfaces or treated samples where contrast and colors are the primary indicators of different phases.
Detection and calculation channels
For simple topographic surfaces, particle detection and parameter calculation are performed on the same data in metric units.
For multichannel studiables, it is possible to differentiate the detection and calculation channels. For instance, you can detect particles thanks to a given physical property and calculate your parameters on a channel with another unit (topography, amplitude, phase, stiffness…) This allows you to optimize the accuracy of your analyses.
Additional detection methods for studiables containing at least one image channel are also available: SEM-BSE (Multiple threshold segmentation), SEM-SE (Object-oriented segmentation) and Color segmentation.
Particle classification
Mountains® also offers a powerful tool called “Particle classification”. This tool can create several classes defined by one or several criteria. Indeed, particles can be classified according to their specific characteristics, i.e. a parameter calculated in the study.
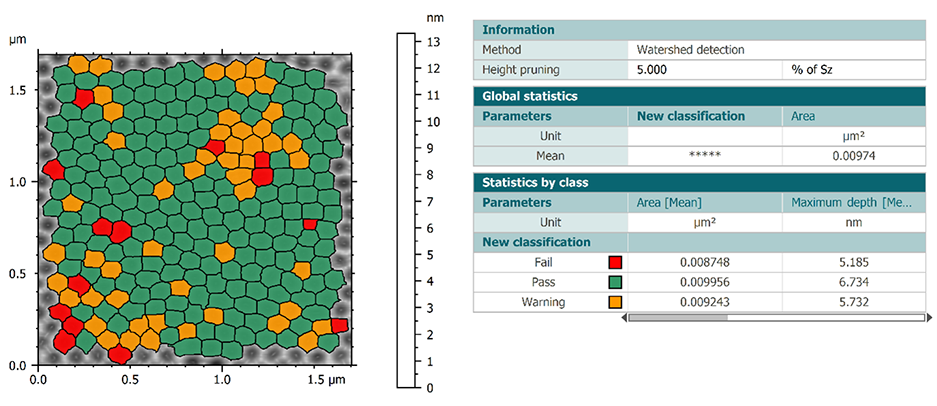
The creation of classes leads to the creation of a new table of results called “Statistics by class”. This table combines the parameters calculated individually on each particle into statistical parameters divided into classes.
See particle classification in action in our webinar series:
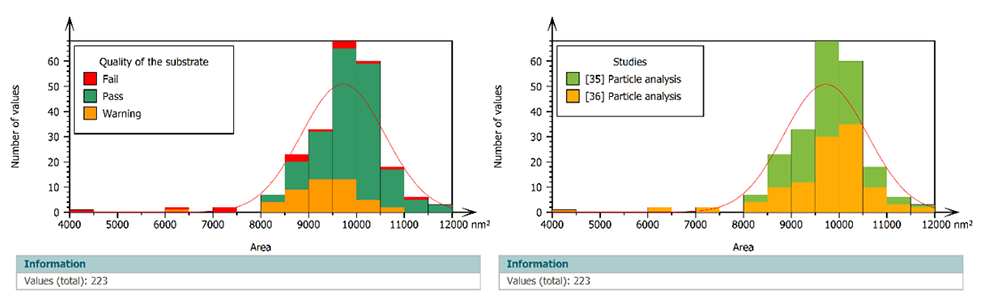
Aggregation
Within a single document, you can perform multiple particle analyses on similar samples. It is then possible to aggregate the obtained results and visualize them as a whole in various graphical forms (histogram, control chart, box plot…)
Advanced statistics on large populations
If you have a large population of similar studiables, we recommend that you prepare a template to be applied to the entire population via a statistical document.
This document allows you to automate your analysis procedures while allowing the creation of adapted statistical studies. It is then possible to visualize the impact of each studiable on the final results.

Above. Control chart showing all individual results from aggregated populations.
Learn more about particle analysis, classification and automation in our webinar series:
Would you like to perform Particle Analysis on your own data?
Try Mountains® surface analysis software for free
Author : Mathieu Cognard, SPM product manager, Digital Surf