There are ~40,000 species of fish on our planet – more than mammals, birds, reptiles and amphibians COMBINED! This great richness of species is also mirrored by a vast diversity of forms – fishes can look like everything from tunas to seahorses and anglerfish to eels. One aspect of this diversity is fish scales, which look different among different groups, species and even among different locations on a single fish. Dylan Wainwright (Purdue University) along with George Lauder and James Weaver (both at Harvard University) sought to explore scale texture in three dimensions with MountainsMap® software.
Dylan Wainwright (assistant professor at Purdue University)
Introduction
Scales are bony overlapping plates that cover fish bodies. They importantly serve as physical armor, defense against parasites and they house the lateral line sensory system, which fish use to sense water movement around them. Scientists also think that scales may have beneficial hydrodynamic effects by reducing drag over the skin, allowing fish to swim more efficiently.
Despite all of these important roles that scales play, we know very little about how the wide variety of scales is related to these different functions. In addition, we lack methods for studying fish and other biological surfaces in three dimensions, which is crucial for quantifying structural differences, understanding possible functions and making comparisons between different species.
Methods
We used a gel-based profilometry device made by GelSight Inc. (Waltham, MA USA) and MountainsMap® software to make the first three-dimensional, topographic images of fish scale surfaces on the body of preserved fishes from a natural history museum collection (Harvard Museum of Comparative Zoology).
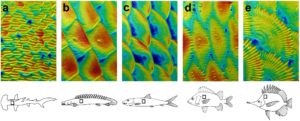
Figure 1: Different fish scaled types displayed using MountainsMap®. (a) Placoid scales of the smooth hammerhead (0.75 x 1.09 mm; z-height = 24.5 µm). (b) Ganoid scales of the barred bichir (7.5 x 10.9 mm; z-height = 331 µm). (c) Cycloid scales of the bonefish (7.4 x 11.1 mm; z-height = 108 µm). (d) Spinoid scales of the sabre squirrelfish (8.2 x 11.9 mm; z-height = 181 µm). (e) Ctenoid scales of the yellow longnose butterflyfish (1.3 x 1.8 mm; z-height = 36.1 µm).
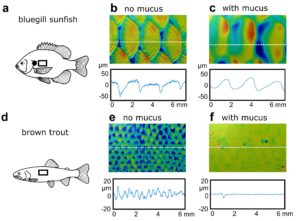
Figure 2: The skin surfaces of both bluegill sunfish and brown trout both with and without mucus. Height profile lines are given where the dotted line crosses each surface. Mucus changes surface texture in different ways in the two species, but overall makes surfaces smoother.
We then used Mountains® software to do form removal and calculate surface texture parameters like roughness (Sa and Sq) as well as skew and kurtosis of the surface. These measurements allowed for the first comparison of surface texture among different fish species, marking a major step forward for this subject. This method also worked well on a number of other biological surfaces, from bat wings to leaves.
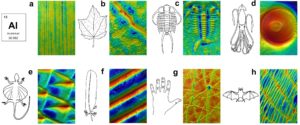
Figure 3: Many biological surfaces can be imaged and analyzed with gel-based profilometry and MountainsMap®. (a) Extruded aluminum (1.5 x 2.3 mm; z-height = 5 µm). (b) Red maple leaf (0.7 x 1.1 mm; z-height = 31 µm). (c) Trilobite fossil (14.8 x 22.2 mm, z-height = 915 µm). (d) Sucker from a giant squid (14.8 x 22.2 mm; z-height = 3.03 mm). (e) Flying lizard belly scales: 0.9 x 1.3 mm; z-height = 117 µm. (f) Red-tailed hawk feather (0.8 x 1.1 mm; z-height = 152 µm). (g) Back of human hand (2.9 x 4.3 mm, z-height = 86.4 µm). (h) Greater mouse-eared bat wing (6.6 x 9.9 mm, z-height = 205 µm).
Conclusion
Since this manuscript was published, we have successfully used MountainsMap® software to study a number of surfaces and published papers on the surfaces of dolphins, sharks and multiple species of fish, all in an effort to learn about the structure and role of different skin textures in aquatic organisms.
These studies help us better understand the diversity of life on our planet and how evolution acts on the relationship between structure and function to create diversity. Learning about the structure and function of organismal surfaces may also help inspire new technology for man-made surfaces someday.
Further reading
Imaging biological surface topography in situ and in vivo. D. K. Wainwright, G. V. Lauder, J. C. Weaver. Methods in Ecology and Evolution. Vol 8, Issue 11, 2017. doi.org/10.1111/2041-210X.12778
Or visit the authors’ websites: Dylan Wainwright: https://www.dylanwainwright.com/
George Lauder: https://sites.harvard.edu/glauder/
James Weaver: http://www.mass.bio/m/b.html
Instruments Used
GelSight Inc. profilometry device + MountainsMap® software.