With the introduction of the new Color segmentation tool in Mountains® software, it is now possible to complement topographical wear analysis such as fretting fatigue tests and wear of mechanical pieces. This feature allows users to isolate zones based on true color and define a number of components to detect, in order to visualize and calculate coverage, thus enabling wear analysis on images without any topography.
Test conditions
The following tribological test was carried out on a Ni-Pd substrate coated with a 1µm-thick layer of gold. The test simulates the behavior of connector fretting that can be found in aircraft engines. Such connectors are made to withstand harsh conditions such as high temperatures, vibration & fuel contamination.
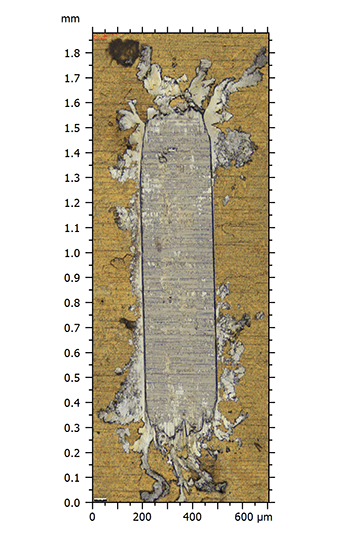
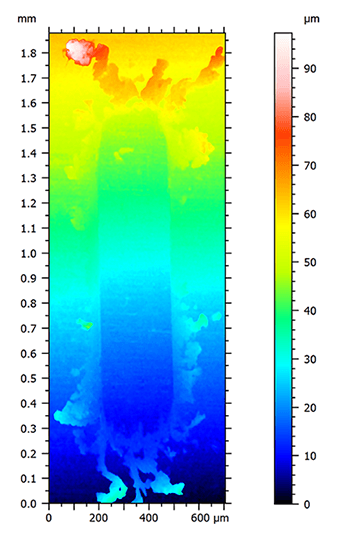
Top. True color view and pseudo-color view of the surface topography of the Ni-Pd substrate sample.
The test was carried out replicating extreme conditions with the use of a linear pin on plan solicitation and a contact force of several newtons. Alternative back and forth movements were repeated throughout the analysis to mimic fretting conditions.
The goal of this study was to identify the amount of wear caused by the constraint applied to the mock connector by the number of repetitive movements, as well as the lubrication treatment employed on the sample. We were also interested in observing the interactions between the connectors and the abrasion of the gold deposit.
The analysis of a color image can provide results that cannot be obtained using topography.
Method
The first step was to level out the topographical surface. This highlights the various zones of interest and metal debris. Once the surface is leveled, multiple studies can be performed on the sample. Here, we used a step height analysis allowing the estimation of the Z difference between the substrate and the wear.
The Histogram study confirms that the wear is approximatively 3.3 µm, thus affecting the 1µm gold deposit. Topographical data allows the quantification of the volume of debris induced by the tribological test. But the standardized analysis of the worn area, coverage seems to be difficult as the trench and the debris have different heights.
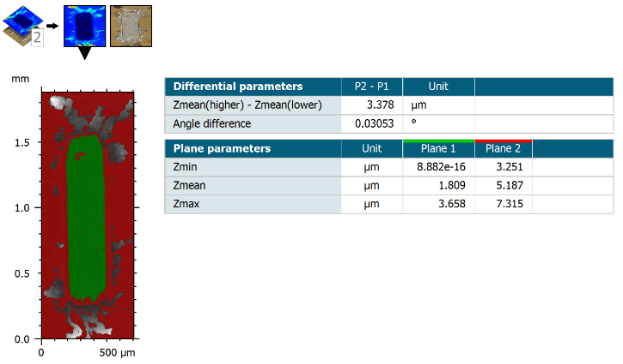
Above. Step height analysis of a Ni-Pd substrate sample, in which we can observe the results of two planes.
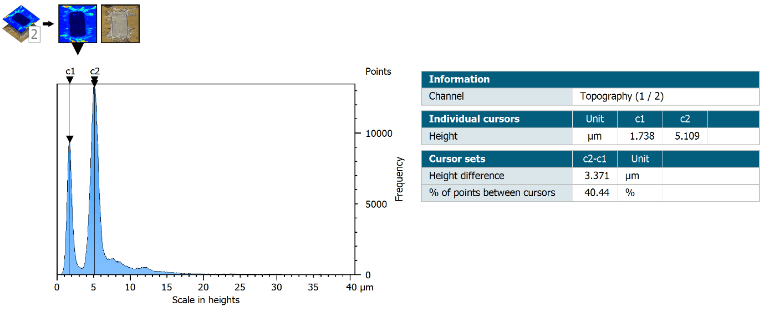
Above. Histogram and Abbott Curves which allowed us to measure the wear of the surface.
To go even further, we performed particle analysis on the image using the Color segmentation option. Thanks to this method, we were able to isolate both components (wear and substrate) by their color. To do this, we just had to define the number of components in the sample that we wanted to visualize.
This study can discretize components much more easily than when using topography. In order to properly evaluate the wear on the surface – which is caused by the fretting effects of components such as ball bearings, rivets, fuselages and connectors – we needed to assess the wear, the coverage and the possible presence of residues on the surface. Every piece of information is crucial to ensure safety and robustness.
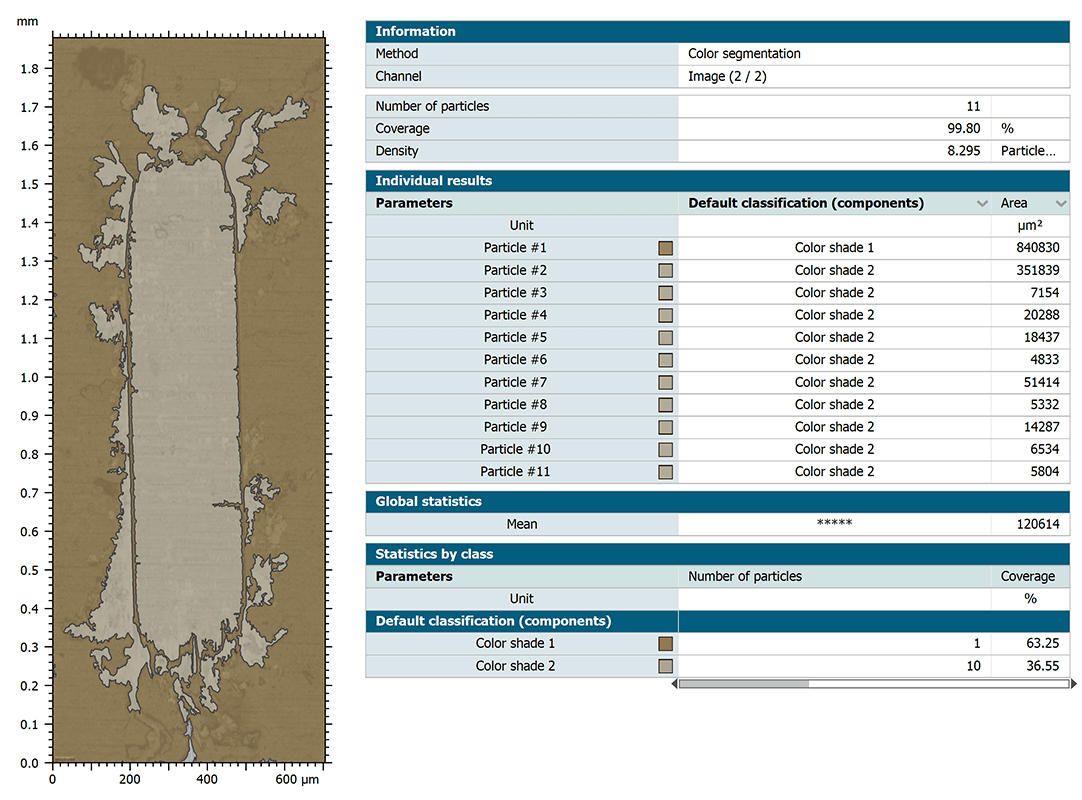
Top. Color segmentation via the Particle analysis tool.
Conclusion
This study was carried out to simulate an extreme situation in order to clearly see the harmful effects that fretting can have on components. Using MountainsImage® along with the Color segmentation tool, available via the Particle analysis study, were able to visualize, analyze and interpretate results quickly and easily, thus demonstrating that this tool can be a powerful asset for microscopists out there, particularly those analyzing light microscopy images.
Instruments & software used
Light microscope & MountainsImage® software
Author
Mathieu Cognard, product manager for SPM and light microscopy applications at Digital Surf