A major preoccupation of the industry and research institutes working in the field of optoelectronics consists in constantly increasing device performance, improving processes and reducing costs.
Digital Surf’s partner Attolight (based in Lausanne, Switzerland) is specialized in an innovative type of hyperspectral technology known as “Quantitative cathodoluminescence”, or Quantitative CL, capable of quickly generating valuable data in cases where traditional spectroscopy techniques meet their limits.
This technology enables users to analyze thin films and optoelectronic devices in a very fast and efficient manner. This is particularly useful for identifying process and material faults, performing quality control and accelerating the introduction of new manufacturing processes or new product generation.
In the example below, Quantitative CL technology coupled with the power of Mountains® software makes it possible to localize and identify degraded layers in state-of-the-art green laser diodes.
Stress analysis of a laser diode
Attolight’s quantitative cathodoluminescence (CL) microscope is used for fast and non-intrusive failure analysis in solid state lighting (LEDs and laser diodes) and high power electronics. Its excellent spatial resolution, combined with hyperspectral capabilities, allows layer-by-layer localization and identification of degradations in devices.
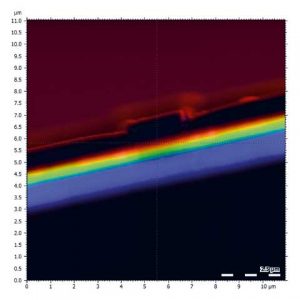
The image above shows a laser diode before deterioration caused for example by thermal or electrical stress.
AttoMap software, based on Digital Surf’s Mountains® Hyperspectral software, proves to be the perfect tool for locating, characterizing and understanding this kind of defect.
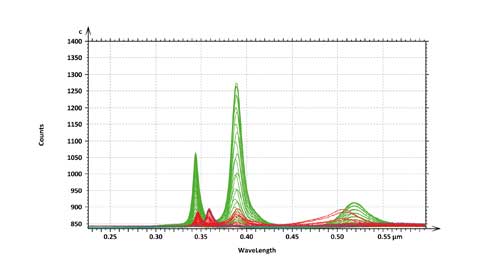
As can be seen in the above chart, using the Extract spectra operator in Mountains® makes it possible to compare spectra from the two lasers.
Here the green curve represents the fresh laser and the red the damaged laser. The difference between the two can be precisely quantified.
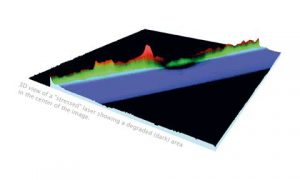
Mountains® also allows users to transform RGB images captured by CL microscopes into 3D models, where the third dimension corresponds to the cathodoluminescence intensity.
This 3D map can be viewed at any zoom level and angle and in real-time which greatly facilitates inspection. In this particular case, the 3D view clearly shows the damage caused to the laser.
Instrument & software used
Attolight quantitative cathodoluminescence (CL) microscope + AttoMap software based on Mountains® technology