⇒ Visualize hyperspectral images and series of spectra
- Explore data using a range of visualization modes:
- display all spectra or only selected spectra
- show spectral maps for a chosen wavelength or a spectrum at one map point
⇒ Process hyperspectral images and series of spectra
- Sort and remove erroneous spectra
- Smooth spectra
- Use Principal Component Analysis to remove noise and outliers
- Correct baseline
- Normalize
⇒ Analyze hyperspectral images and series of spectra
- Create spectral maps using cursors
- Create spectral maps using reference spectra
- Perform multivariate analysis: NNMF, ICA or k-means
- Perform peak fitting
⇒ Correlation maps & surface composition
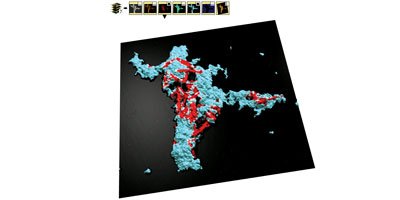
- Colocalize IR, Raman/TERS, cathodoluminescence, photoluminescence, fluorescence, EDX/EDS, X-ray fluorescence and EELS maps with data from other instruments (SEM, AFM etc.)
- Perform correlative studies of chemical composition and topography
- Access an extensive choice of rendering options
- Overlay elemental maps or other spectral/compositional data on SEM or AFM images to obtain spectacular 3D renderings
Included in:
- MountainsSpectral® Expert
- MountainsSpectral® Premium
- MountainsLab® Expert
- MountainsLab® Premium
Available with:
- MountainsSPIP® Expert
- MountainsSPIP® Premium
- MountainsSEM® Expert
- MountainsSEM® Premium