⇒ Visualize and process IV curves
- Cycle through curves in a series and display mean curve and min and max envelopes
- Visualize all curves in a series for comparison
- Apply a smoothing filter and clean up your dataset by removing invalid curves
⇒ Visualize IV spectroscopy images
- Show average intensity at different wavenumbers by sliding cursor along mean IV curve
- Reduce noise using Savitzky-Golay, Gaussian or Median filters
⇒ Extract IV curves from an IV spectroscopy image
- Interactively select IV curves in an IV spectroscopy image
- Extract IV curves for independent study
⇒ Surface composition & correlation maps
- Apply reference curves to IV spectroscopy images to identify composition
- Generate correlation maps
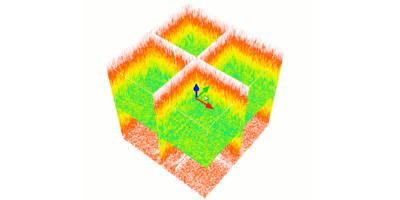
⇒ Visualize IV spectroscopy images in 3D
- Visualize IV spectroscopy images in 3D
- Manipulate cross sections in 3 directions
Included in:
- MountainsSPIP® Premium
- MountainsLab® Premium
Available with:
- MountainsSPIP® Expert
- MountainsSpectral® Expert
- MountainsSpectral® Premium
- MountainsLab® Expert