Thickness is an important parameter for many applications as it affects the functionality, quality and cost of manufactured products. New tools released recently in Mountains® software give users access to a wealth of options for calculating, quantifying and analyzing thickness. Christophe Mignot, Digital Surf CEO, explains more.

Data requirements for analyzing thickness
Typically, a profilometer produces a single surface measurement. In order to analyze thickness, it is necessary to dispose of at least two surfaces, for example the upper face and the lower face of a membrane. Several methods allow users to obtain these two measurements:
- measuring two surfaces successively using a profilometer, SEM or AFM (applications in nanotechnology, including MEMS)
- measuring two different layers of the same sample simultaneously using optical techniques, in particular confocal microscopy (applications in transparent films, coatings etc.)
- measuring a flexible surface using a profilometer equipped with a dual sensor (eg. banknote, plastic packaging).
Industrial applications of thickness analysis
Controlling thickness is essential in many domains of industry.
- Checking thickness homogeneity of sealing membranes (eg. radial shaft seals) helps ensure efficiency during operation and longer life.
- Measuring varnish thickness is useful in fine art conservation for assessing previous treatments applied to paintings.
- Thickness analysis of transparent or semi-transparent layers is widely used in quality control of composite plastic materials.
- Controlling thickness of MEMS accelerometers in airbag systems is used to check performance.
- Devices where resonance is important at any scale, from musical instruments to quartz crystals: here again, thickness is an essential functional parameter as it is directly linked to resonant frequency.
Tools for studying thickness in Mountains® 9.2
Mountains® 9.2 released in May 2022 provides a comprehensive set of tools for performing thickness visualization and analysis.
Align thickness pairs
As previously mentioned, in most cases, a prerequisite to thickness analysis is the alignment of two measured datasets.
Thanks to Mountains®’ capacity for managing a large number of data types, these datasets can be simply two separate surfaces or they can originate from surface-image studiables, series of surfaces, multi-channel images etc.
A new operator allows users to align and adjust these surfaces and generate a series of two surfaces corresponding to the two sides of the membrane (or layer) on which thickness mapping is required. A wide variety of settings are available to cover the needs of the various types of source measurements mentioned previously.
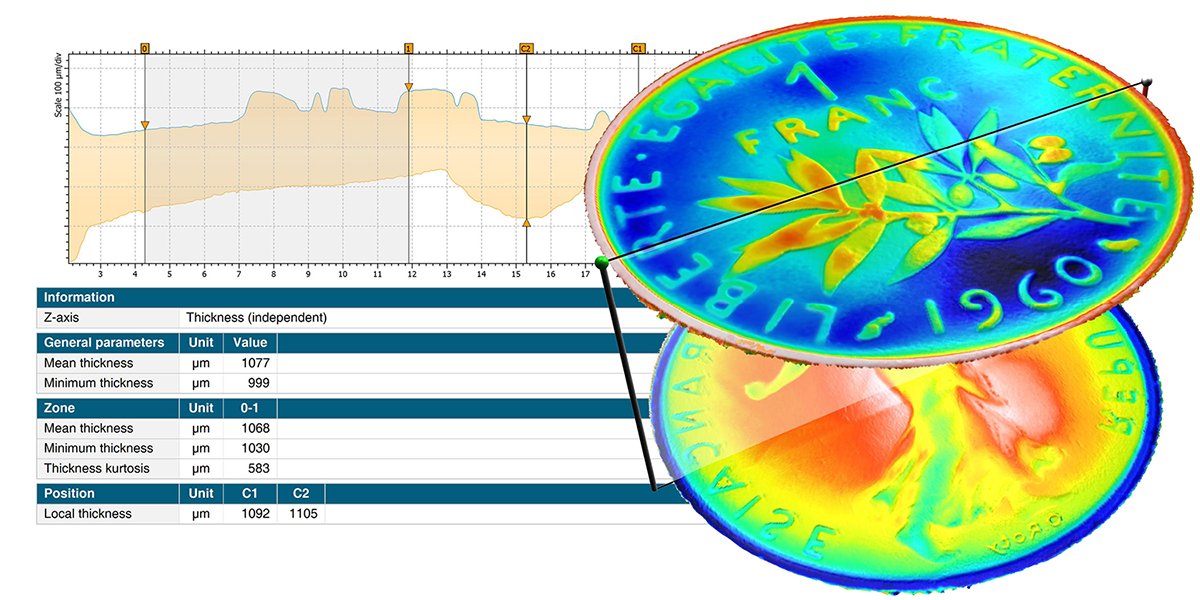
Above: 3D thickness visualization and two-profile 2D analysis of upper and lower membranes of a one franc coin
(the “Align for thickness analysis” operator was applied on these two surfaces measured in succession).
Examine thickness in 3D or in cross-section
Once aligned, the membrane, composed of an upper and lower face, can be visualized in stunning Mountains® 3D.
Cross-sectioning can be performed directly on the 3D view, in order to obtain the thickness parameters on a particular zone.
Carry out 2D analysis on a double profile
In Mountains®, thickness membranes are considered as series of two surfaces. This means a vertical cross-section can easily be obtained using the existing Extract Profile operator.
By moving the cursors (orange in the image above), interactive thickness analysis can be performed (values in the table below the profile are updated instantaneously).
Generate thickness parameters
As usual in Mountains®, users can access a wide range of parameters for their analysis. For quantifying thickness, these include:
- mean thickness
- minimum/maximum thickness
- standard deviation
- skewness, kurtosis etc.
Using thresholds, it is also possible to color- highlight areas outside tolerances.
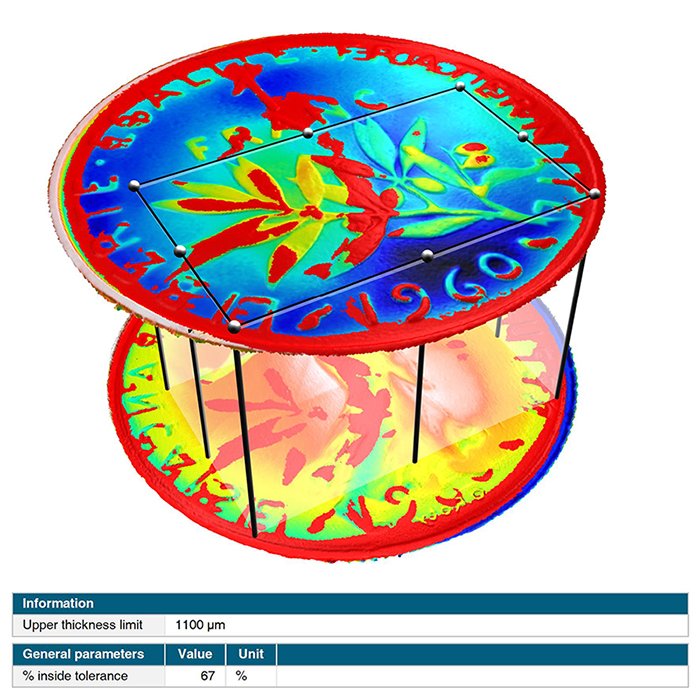
Above: Areas outside thickness tolerances are highlighted (here in red) on the 3D view of data.
How can I access new tools for thickness?
The Thickness Analysis module is now available as an option on any Mountains®-based product allowing topographic analysis. If your Mountains® product is supplied by an instrument manufacturer, please contact them to check if the module is listed in their catalogue.
The Thickness Analysis module is only available with version 9.2 onwards. This version is freely available to users with an active Software Maintenance Plan (SMP). If you don’t have an active SMP, please get in touch to arrange an update by emailing sales@digitalsurf.com.