Particle analysis has never been easier. Check out the video.
Particle analysis is used in research and industry across many fields ranging from quality control of structured materials (metal alloys etc.) to characterization of nano-structure assemblies. Mountains® 8 brings an updated, extensive tool set for quickly identifying and quantifying features in any image or on any surface.
So what’s new?
In Mountains® 8, the very best SPIPTM and Mountains® features have been merged to bring users top-of-the-range tools for particle analysis.
This means access to a range of detection methods, improved interactivity and new options for calculating and displaying data.
How are particles detected?
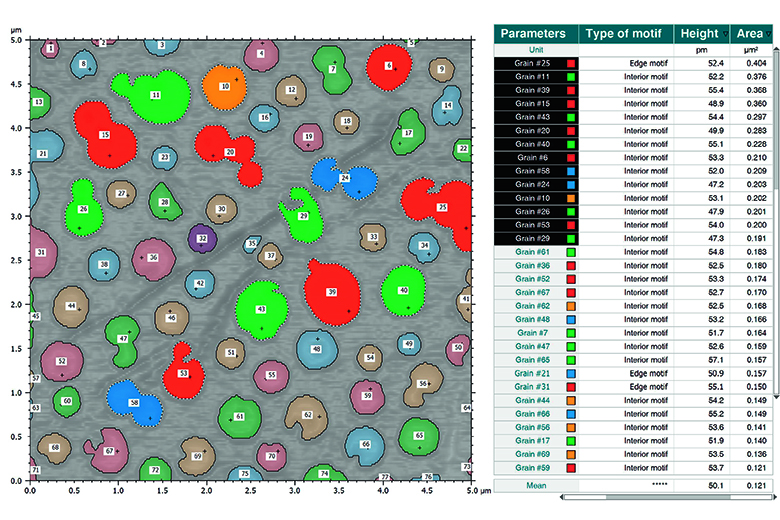
Mountains® 8 particle analysis offers four feature detection methods based on different segmentation principles.
- threshold segmentation (detect particles using user-defined thresholds)
- watershed segmentation (using the method defined in the ISO 25178-2 standard)
- edge detection (apply an edge detection filter)
- circle detection (detect round or spherical particles).
What are the display options?
Users can choose amongst a wide range of graphical representations and customize how they wish to display analysis results:
- overlay (see particles in pseudo-color)
- motifs (see on a monochrome background)
- colored (use color and manage transparency)
The particles can be classified and colored based on user-defined settings; various charts and statistical results are available.
What do you mean by improved interactivity?
Particle analysis is fully interactive. You can click on any individual particle and instantly jump to the relevant row of the parameters table and vice-versa.
Available parameters include: motif type (open or closed), height, area, volume, X, Y and Z extremum, number of neighbors, pitch, coflatness, perimeter etc. Mean morphological parameters can also be displayed for the entire image.
All results can be exported directly to Excel and Word or in PDF format.
And what if I’m using multi-channel data?
No problem! For multi-layer data, a selection tool allows users to choose which layer to use for feature detection and parameter calculation.
You may also be interested in:
MountainsSPIP® webinar: particle analysis