We are excited to announce that Mountains® 9 is now available. This new release comes packed with many new features including a new-look interface, surface texture analysis on freeform surfaces (shells) and analysis of multi-channel cubes of compositional data.
Watch the launch video or scroll down to discover all the new features!
New Mountains®9 range
With version 9, we are proud to introduce a 4th branch of Mountains®software, MountainsSpectral®, as well as several new optional modules.
- MountainsMap®, introduced in 1997 and regularly enhanced since, has become the gold standard for surface data analysis in research and industry.
- MountainsSEM®, introduced with version 7, revolutionized Scanning Electron Microscope image analysis
- MountainsSPIP®, launched in 2018 following the merge of Digital Surf’s Mountains®platform and Image Metrology’s SPIPTM, and was rapidly adopted by users worldwide for Scanning Probe Microscope image analysis
- MountainsSpectral® completes the version 9 range, providing tools for Correlative and Spectral Analysis
- Now, with our multi-instrument solution MountainsLab®, practically any type of data from profilometers and microscopes can be brought together in the same place, ensuring streamlined workflows and meaningful results. Specific tools make correlative analysis of data from different sources efficient and easy.
- 3 new modules make their debut in version 9:
- Shell Topography
- Chemical cubes
- IV Spectroscopy
General features
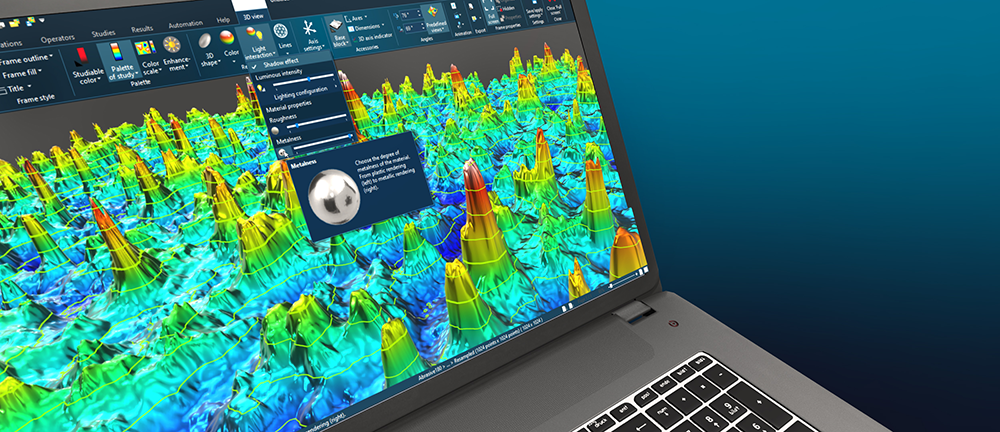
New look interface
- Mountains®9 introduces a new “Dark” screen theme (by default)
- 4 other themes available: version 8 gray, white, orange & blue
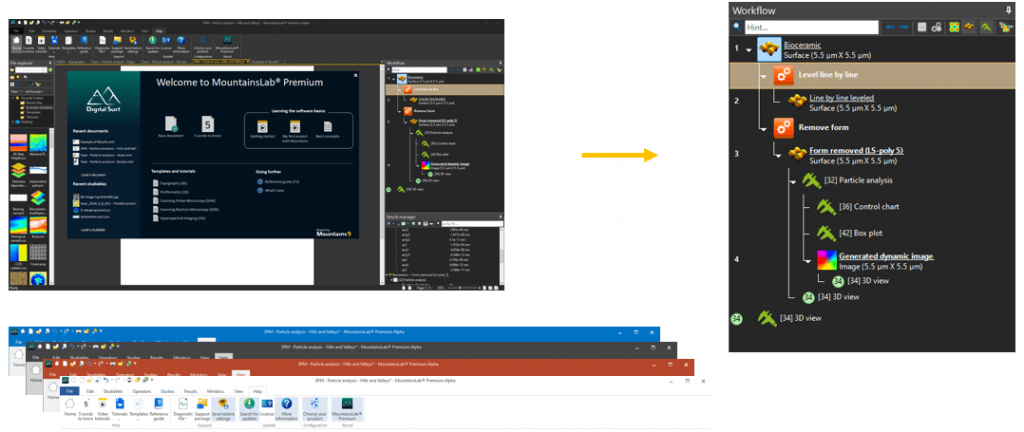
- Workflow has been modernized for a better readability
Built-in statistics tools for all
- Mountains®9 provides all the tools you need for statistical analysis! No need to export results to other programs.
- Powerful statistical tools for handling large quantities of measurement data including:
- « Results » tab makes visualizing and organizing series of results quicker and easier
- Visualize results instantly with Control chart, Histogram, Scatter plot, Box plot etc.
- Automatic statistical analysis of multiple data population types (static or dynamic) using templates
NB: all product levels now include statistics tools
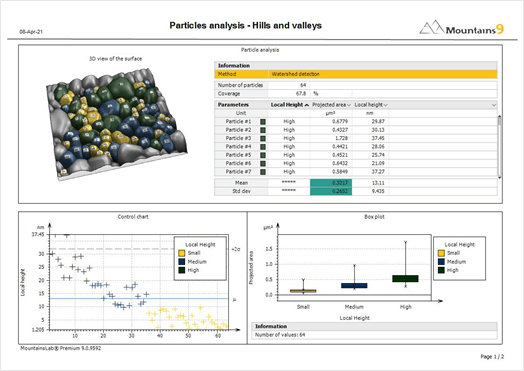
Image comparison slider
- New slider available for users working with multiple images or layers (including surface-image studiable)
- Works vertically or horizontally
- Useful for SPM multi-channel image analysis (compare layers interactively)
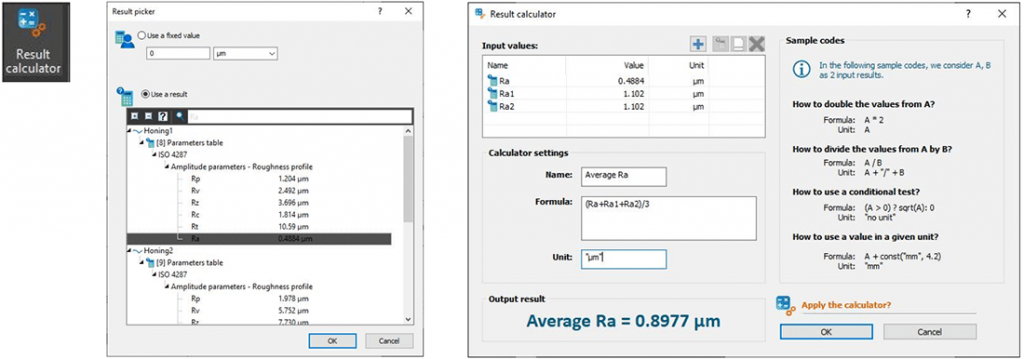
Result calculator
- Perform calculations using several results/parameters already in your Mountains® document
- Go to Results tab and pick the results you wish to use for the calculation
- Rename them and decide how you want to display (in the Results Manager or in the document)
New analysis features
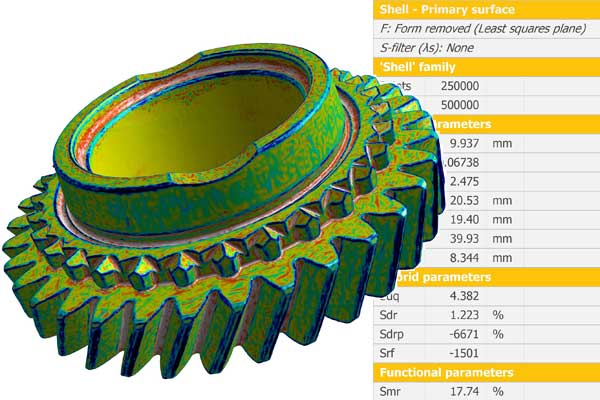
Metrology now on shells (freeform surfaces)
Freeform surfaces are the next paradigm shift in the field of surface metrology. Mountains®9 proves once more to be at the cutting-edge of new industry practices by adding a whole new metrologicialtoolbox for shell studiables.
- Visualize surface curvature and deviation as colors on your 3D
- Fit a reference form (plane, cylinder, sphere)
- Apply Gaussian-like filtering to calculate a smooth reference surface
- Calculate freeform surface texture parameters
- Height parameters
- Hybrid/Spatial parameters
- Volume parameters
- And also: new Lighting options, Identity card study, Extract area (ROI) operator, Remeshoperator etc.
Point clouds now compatible
Point cloud datasets are frequently used for metrology and quality inspection. They can now be loaded and manipulated in Mountains®.
- Load and visualize data from 3D scanners etc.
- Animation and rendering options allow you to enhance data visualization
- From Point Cloud to Surface: Extract a Surface from your Point Cloud for further metrological analysis
- From Point Cloud to Shell: Mesh tool (available August 2021)

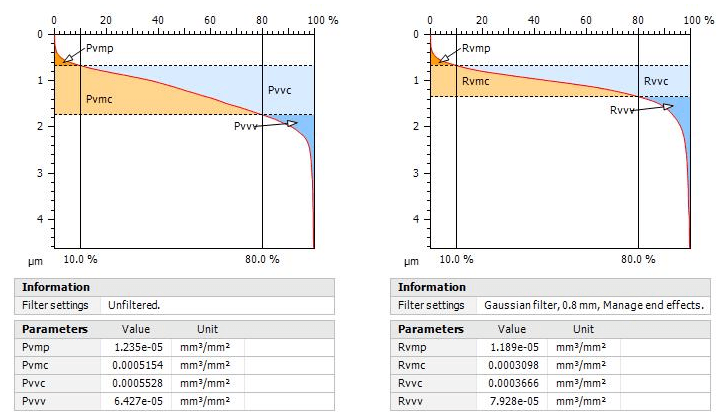
New graphical study on 2D (profile) volume parameters
Volume parameters study now available on profiles
- Pvmp, Pvmc, Pvvc, Pvvvetc. when calculated on primary profile
- Rvmp, Rvmc, Rvvc, Rvvvetc. when calculated on roughness profile
- Visualize how functional volume parameters are calculated from the Abbott curve
- Also new: Volume parameters study on filtered surfaces
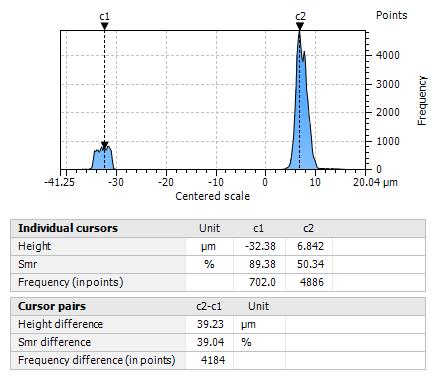
Improved Abbott curve & histogram tools
New options for those studying height distribution:
- Automatic calculation of heights
- Zoom in on any part of the histogram
- Visualize Smron curve
- Display frequency values as a parameter
- Automatic number of bins
- Etc.
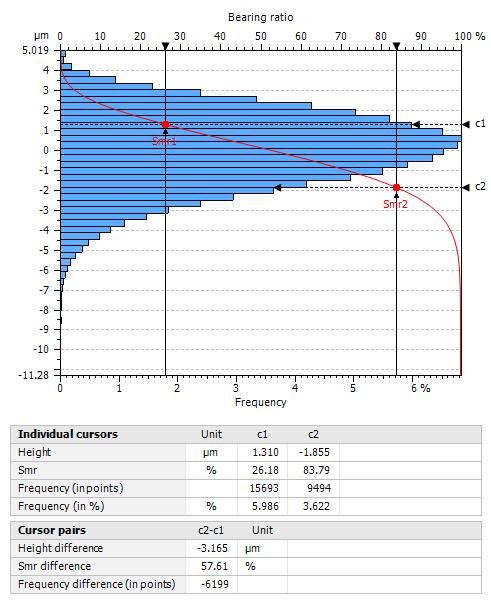
Above: Visualize Smr on curve, display frequency values of individual bins
Above: Zoom in on a portion of the histogram to see details
Other new features for profilometry users
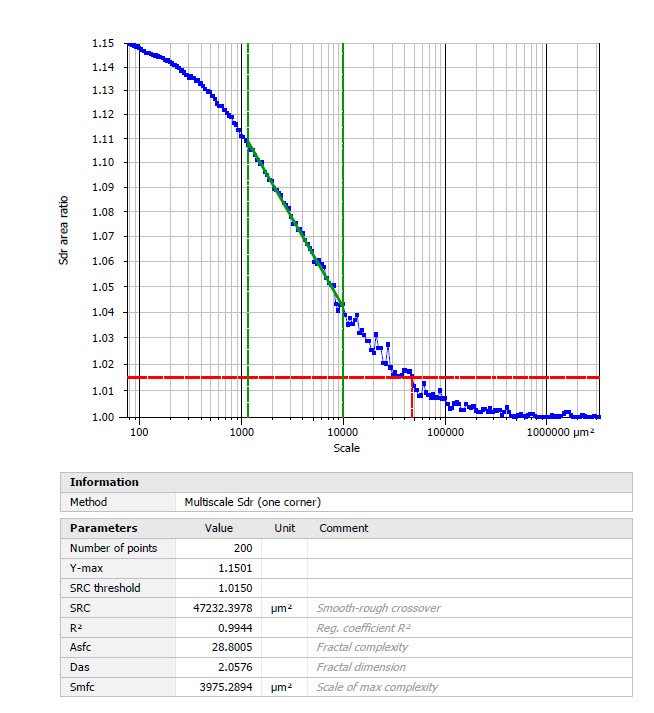
- New in Scale-Sensitive Fractal Analysis (SSFA):
- Improved multi-scale Sdrmethod: faster, more robust calculation method (especially on large batches of data)
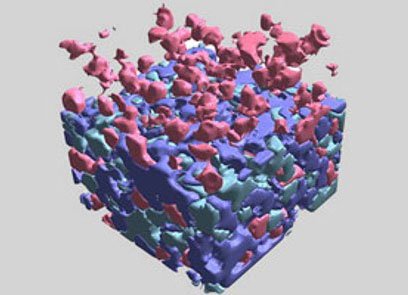
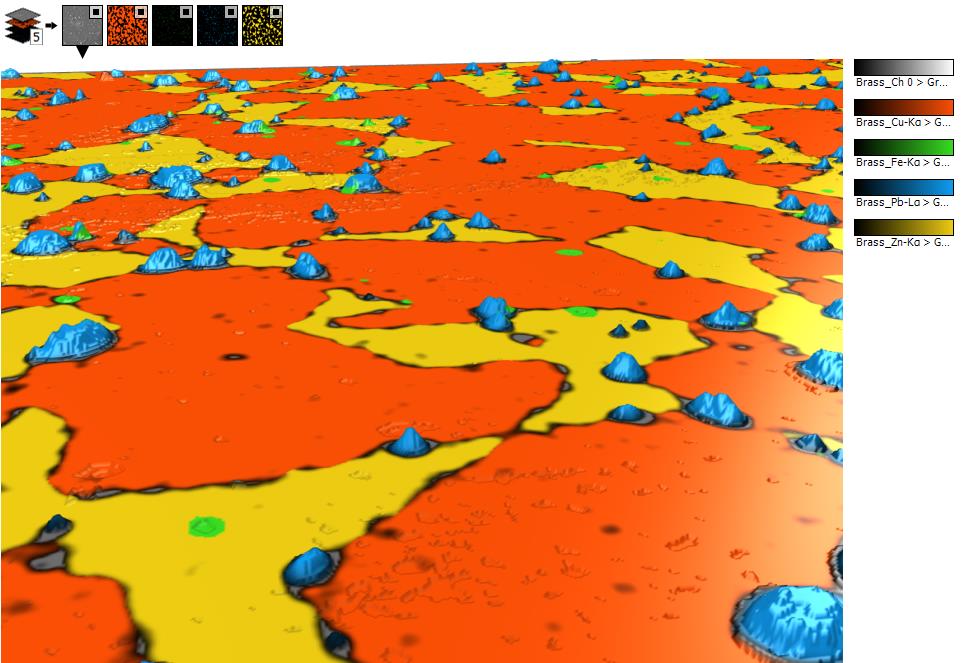
Visualize composition of materials in full 3D
- Associate 3D imaging & chemical analysis
- Load multichannel cubes of compositional data (“chemical” cubes)
- Choose from a wide range of visualization & animation settings
- Slice through cubes to visualize them from the inside
- Extract 2D images and multilayer files for further analysis (generate particle statistics by material type etc.)
- Generate Shell studiablesfrom multichannel cubes
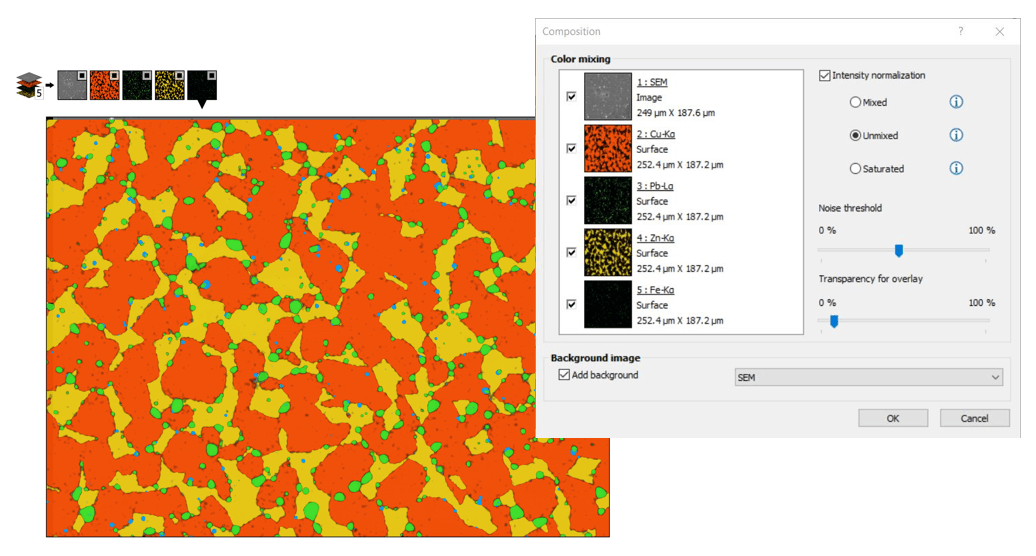
Compact toolbox for Correlative analysis
- Extended options for colocalizing Raman, cathodoluminescence, photoluminescence, fluorescence, EDX/EDS and EELS maps with data from other instruments (SEM, AFM etc.)
- Optimize rendering and palettes
- Choose which layers of data you wish to use in rendering
- New color mixing tool: choose to mix layer colors or use dominant color
- Reduce image noise
- Play with transparency levels
Create “3D” effects with EDS/EDX maps
Build spectacular renderings associating EDS (EDX) maps or other spectral/compositional data with SEM images(or topography reconstructed from SEM images if available)
Visualize hyperspectral images in 3D
- View hyperspectral images (one spectrum per pixel) and CITS cubes (IV Spectroscopy) in 3D
- Manipulate cross sections in 3 directions
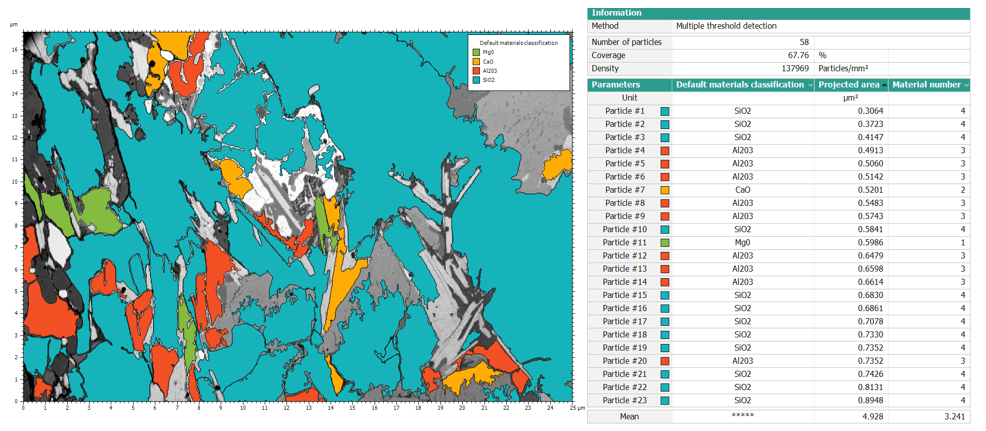
New, dedicated segmentation for SEM
Mountains®9 introduces new, dedicated image segmentation for Scanning Electron Microscope image analysis
- Segmentation for SEM BSE images with multiple thresholding
- Segmentation for multichannel images for elemental analysis
- Use the particle study to classify by material type
- Segmentation for SEM SE images (available August 2021)
Visualize & analyze FIB-SEM tomography
- Load, display and analyze focused ion beam scanning electron microscopy image series as 3D voxel cubes
- Associate 3D imaging and chemical analysis
- Slice through the inside of your materials: choose segmentation and animation settings
- Produce particle and grains statistics from your cubes
Feature available Fall 2021

Improved structure exclusion for flattening
- Fine tune masking thresholds using sliders
- New references for detection
- Definition of thresholds on the distribution histogram
- Real-time preview of changes made to masking
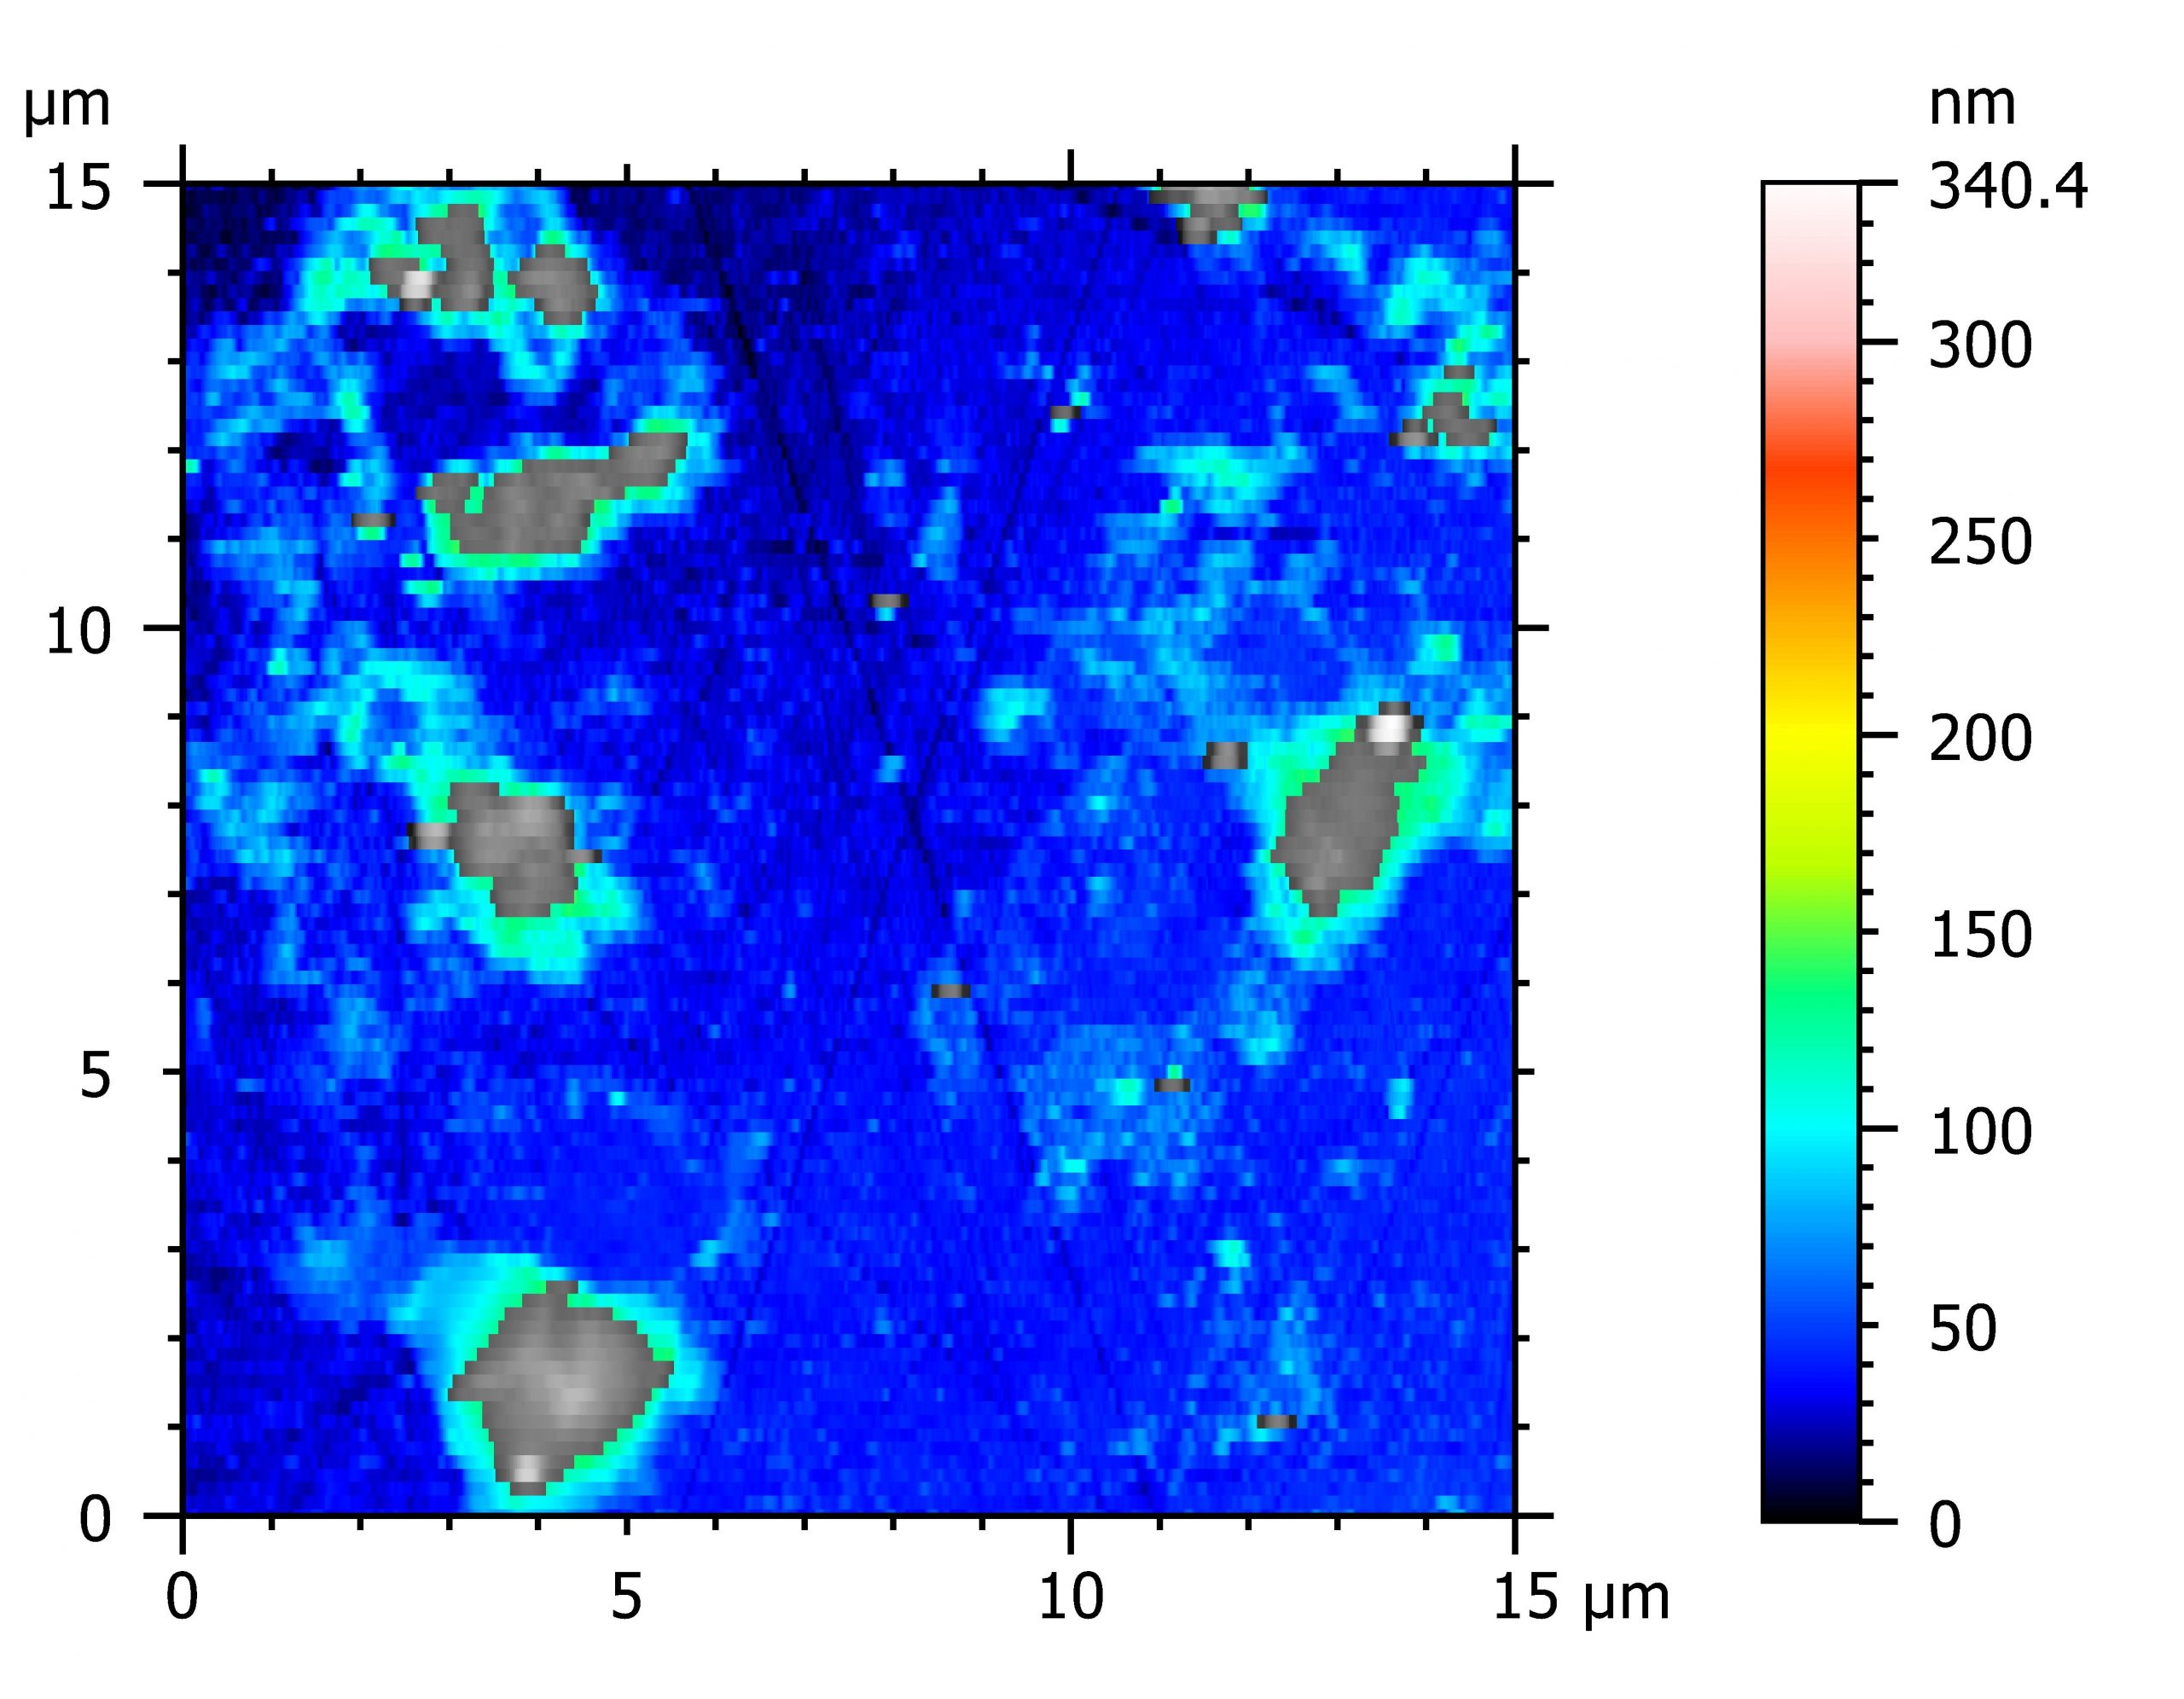
Left: Basic automatic exclusion. Right: Automatic exclusion with improved tool.
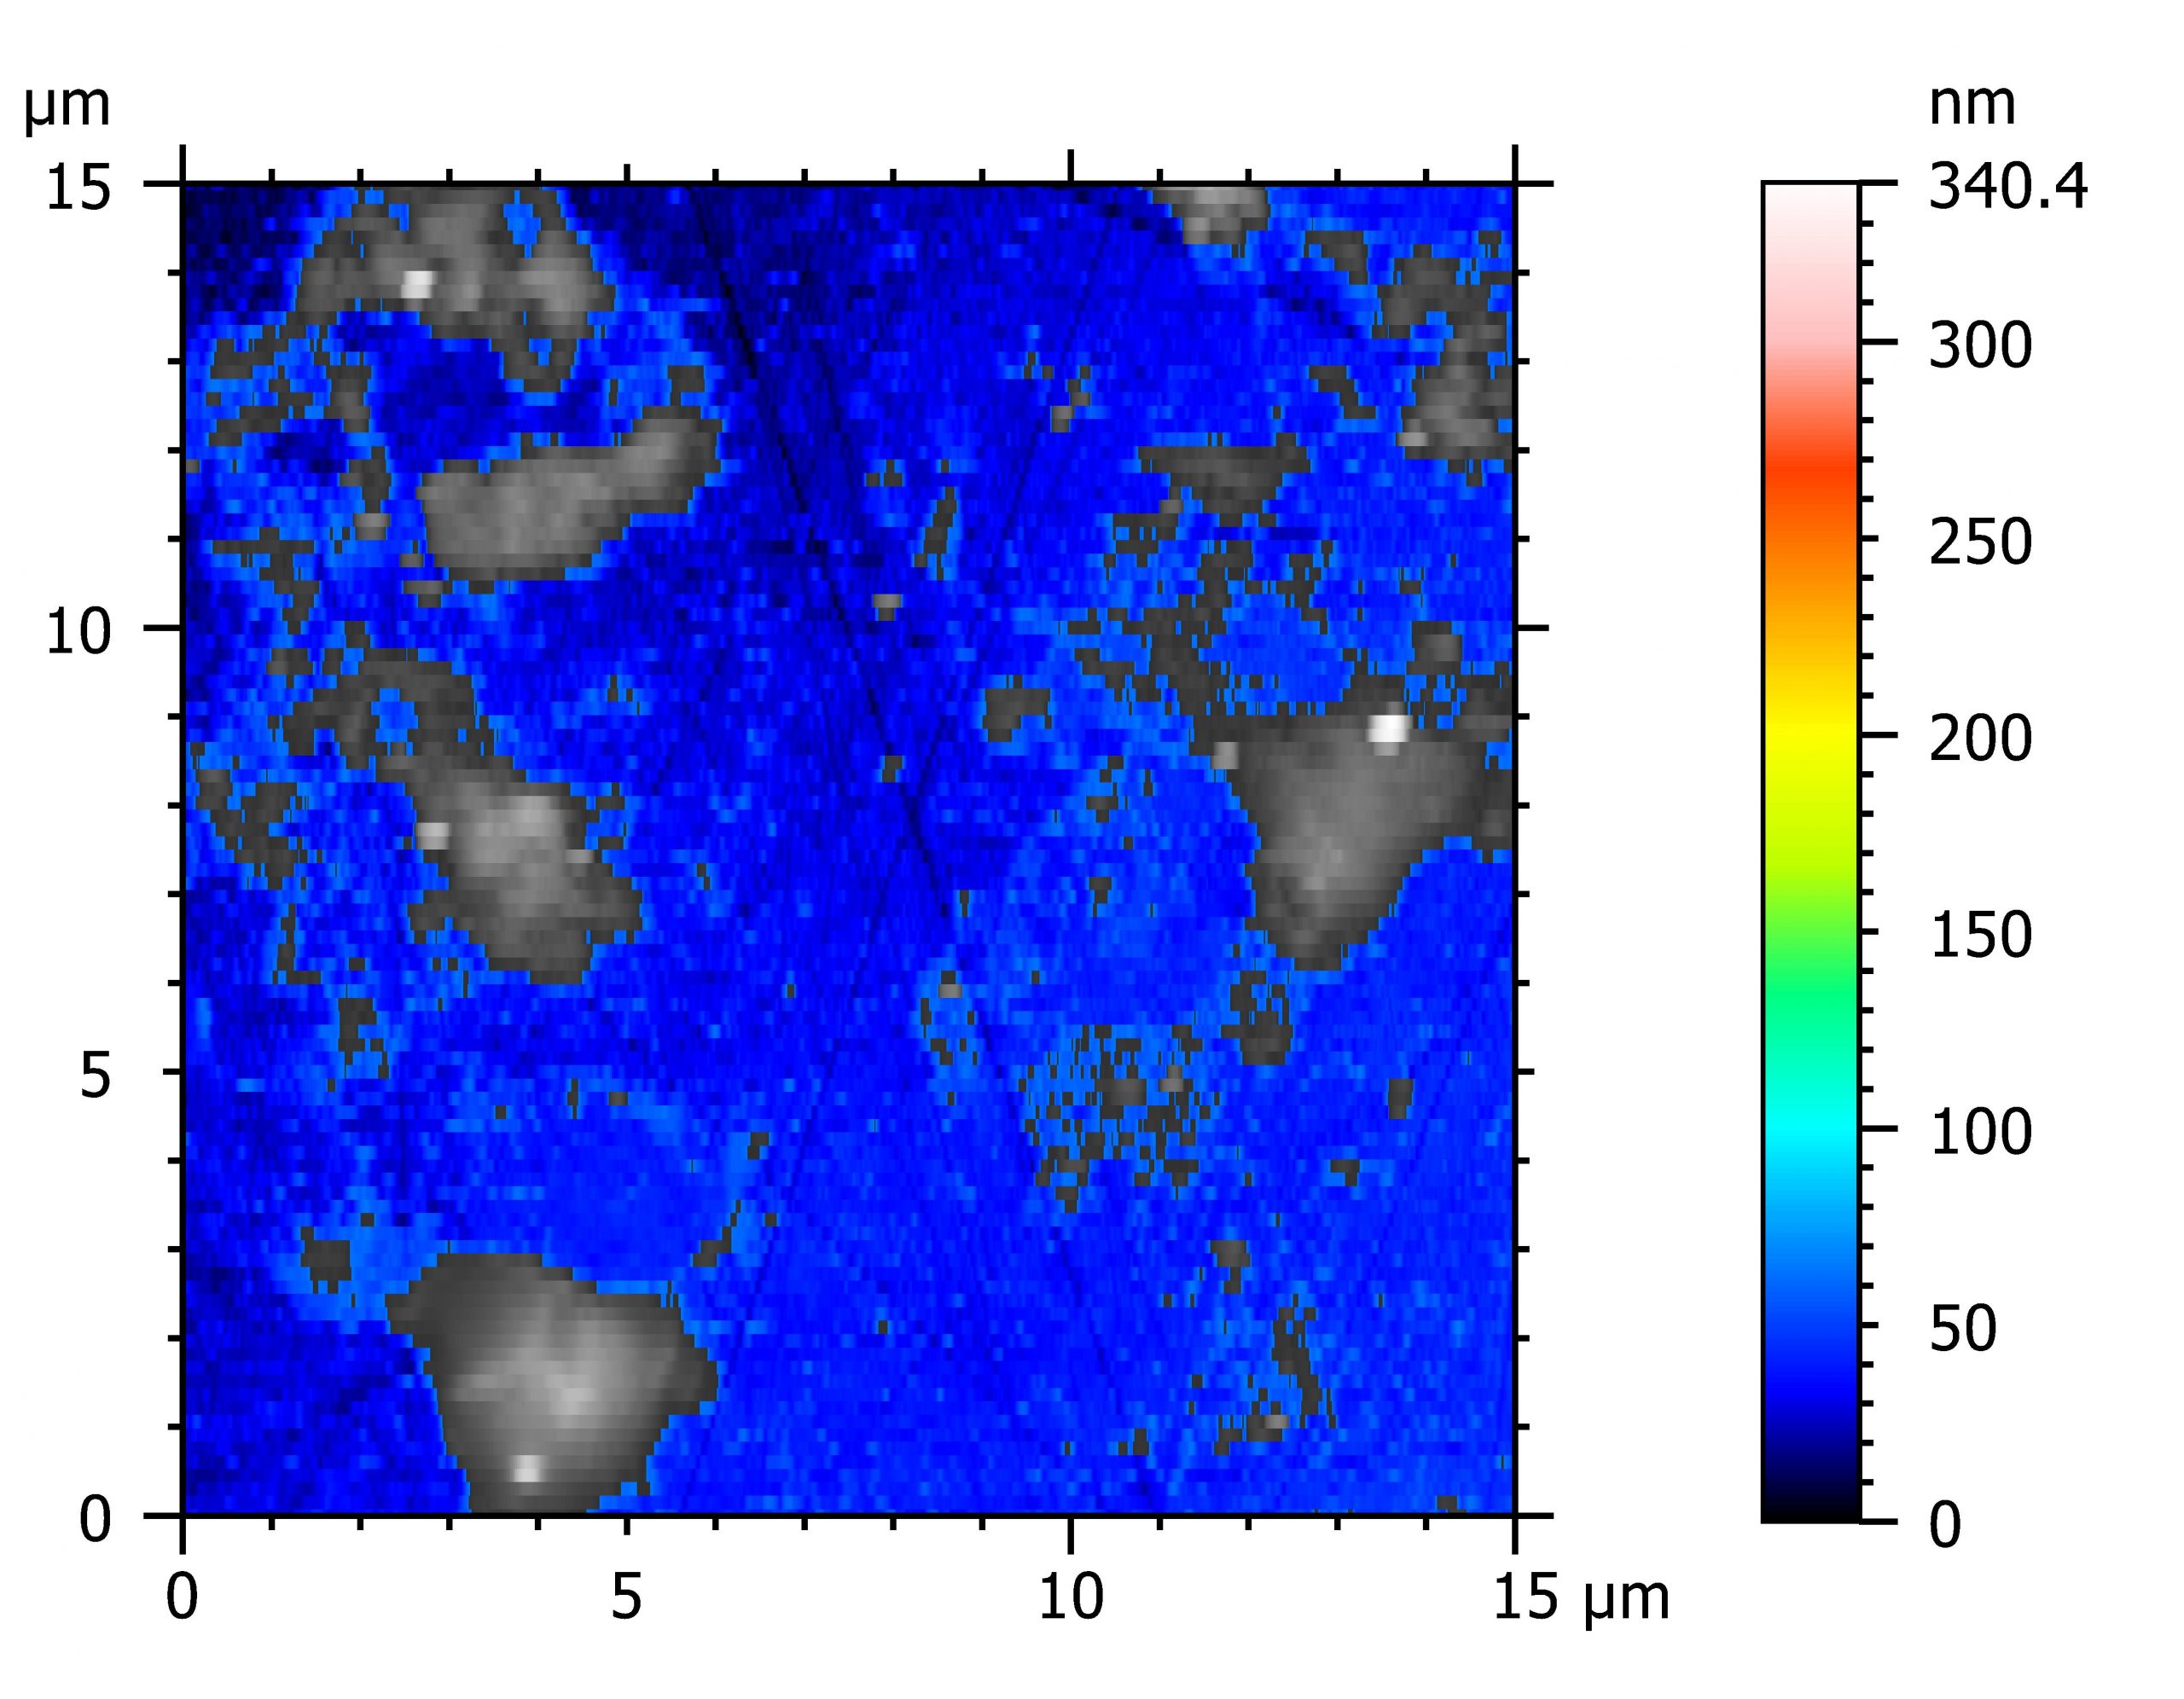
Simplified access to and use of histograms
- Visualize bins vertically when performing AFM/SPM image analysis
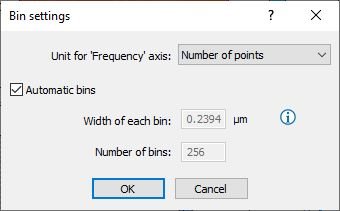
- Automatic number of bins
- Zoom on the histogram
- Changing the display of bins and axes
- Extended interactive mode
- New parameters
- Automatic detection of the 2 main peaks
- Height of the bins in ‘number of points’
Want to get a 30-day Free Trial?
Try Mountains® surface analysis software for free