Dr. Sergei Magonov is an experienced and respected figure in the world of atomic force microscopy (AFM).
With over three decades of practice working with instruments from several different manufacturers, Sergei tells us why highly-specialized tools for preparation, visualization and quantification are the key to understanding AFM data.

Commercial AFM instruments mostly come equipped with software focused on the collection of data. Off-line data treatment capabilities and quantitative examination are typically limited.
This is why it is, in my opinion, essential that AFM users work with specialized software packages such as those based on Digital Surf’s Mountains® platform.
I myself have enjoyed working with Mountains® for a number of years. To demonstrate its value, the following article presents a few examples of AFM image processing and analysis taken from studies of single macromolecules and heterogeneous materials.
Visualization and quantification of single macromolecules
High-resolution profiling of nanoscale objects with an AFM probe has fascinated researchers since images of single DNA strands and their double helical structure were first observed in the early 90s. Since 1996, in addition to natural macromolecules, synthetic polymer chains are also regularly studied using AFM.
The chemists who create these macromolecules greatly appreciate being able to directly visualize the architecture of synthesized polymer chains deposited on an atomically-flat substrate from their dilute solutions.
However, a little data preparation is necessary to make this possible. And that’s where software like Mountains® comes in.
Preparing AFM data for analysis
It is often necessary to subject the raw height images of single macromolecules to processing such as leveling with the exclusion of raised structures and form removal which eliminates occasional sample tilt and tube-scanner bulging.
In Mountains®, these common procedures are very time-efficient and user-friendly. The software offers a broad choice of user-definable color palettes.
The resulting processed images are well suited to quantitative analysis and provide, for example, statistics on macromolecule length (an important characteristic of polymers, related to molecular weight distribution).
Also vital is the examination of chain conformation and changes caused by different factors: temperature, environment etc.
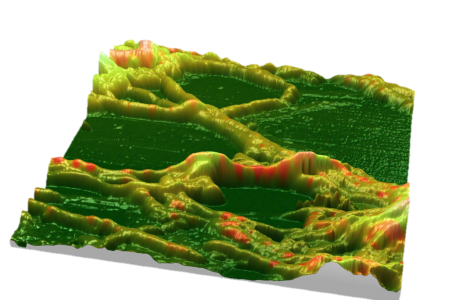
The height image below illustrates polymer macro-
molecules absorbed on a mica surface. Further analysis of these images can be performed for example using the Motifs analysis tool.
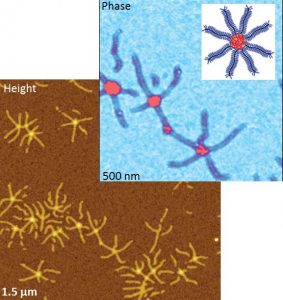
AFM height & phase images of brush macro-molecule.
Top right : sketch of the brush macromolecule
in “spoke-wheel” configuration.
1 – Characterizing membrane morphology
Membranes are important functional components for a variety of applications from batteries to biochemistry.
Size of pores, pore distribution and morphology are valuable characteristics for defining a membrane’s overall performance.
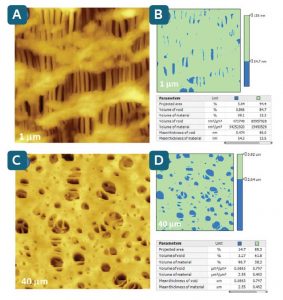
Figure A below shows the surface morphology of a Celgard microporous polymer film containing numerous nano-size voids originated in fibrillar regions separated by densely packed lamellar regions.
To quantify morphology, one can apply the Mountains® Slices tool (figure B), which provides projected areas, volumes and mean thickness of the voids and surrounding material. The procedure is user-controlled with a choice of one or two color-coded threshold levels separating features of interest.
Figures C & D show a similar analysis routine applied to an industrial nitrocellulose membrane with features much larger than those of the Celgard film. The size of the pores varies from tens of nanometers to several microns.
2 – Examination of bitumen composition
Bitumen is broadly used for road pavements and as roofing material. Technological properties of this material depend on its composition and morphology, which can be examined with AFM phase imaging and mapping of local dielectric response.
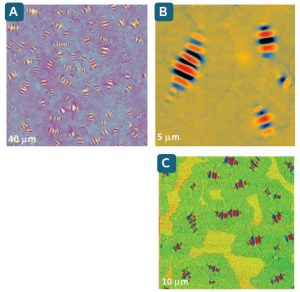
Typically, bee-like structures resulting from surface stress during cooling from high temperature can be observed in height images of bitumen surface regions. As their profiles are corrugated, the leveling of such images is facilitated by automatically excluding features below and above the average level (figures A & B below).
Their heterogeneous morphology and different domains can only be faintly seen here. However phase images are more sensitive not only to topographical features but also to differences in mechanical and adhesive local properties (figure C). Here, the color-coded contrast differentiates bee-like structures and two kinds of surrounding surface domains.
Composition was then quantified using Slices analysis applied to both height and phase images. Comparison of these allowed us to identify the bee-like features with surrounding domains as wax and the other regions as polar asphaltene material, these being two of the multiple chemical constituents of bitumen.
RESOURCES
- S. S. Sheiko, F. Sun, A. Randal, D. Shirvanyants, K. Matyjaszewski and M. Rubinstein, Nature 2006, 440, 191.
- S. Magonov, J. Alexander, M. Surtchev, A. M. Hung and E. H. Fini, Journal of Microscopy 2016, 265, 196.
ABOUT THE AUTHOR
Dr. Sergei Magonov was attracted to field of scanning probe microscopy while working at the University of Freiburg (Germany) in the late 80s. In 1995, he joined Digital Instruments (Santa Barbara CA, USA). His expertise in STM and AFM further developed and he later spearheaded applications at Veeco Instruments, Agilent Technologies and NT-MDT. His contributions to research on the subject include a book, 16 chapters/reviews, over 200 peer-reviewed papers, 6 US patents and more than 40 application notes. As of December 2017, Sergei is a member of SPM Labs LLC where he is involved in the development of AFM instrumentation and novel applications.
Other articles you may be interested in:
Bio-fuels research - fat stored in bacteria