In the world of precision engineering and quality control, the art of surface metrology plays a pivotal role. One powerful tool in the surface metrologist’s arsenal is spectral analysis, a technique that enables us to delve into the complexities of surface topography with great precision. In this article François Blateyron, senior surface metrology expert at Digital Surf, discusses spectral analysis and why it is key to understanding surface texture analysis.

Basics of signal processing
Performing spectral analysis on a signal means examining its content in terms of frequencies (or wavelengths).
The simplest signal is a sine wave, which is defined by its wavelength, amplitude and phase. Wavelength defines the length of an oscillation in the spatial domain (it is given in µm, nm or any length unit). If this wave propagates at a particular speed (for example a value n in m/s) then you can define its frequency f=ν⁄λ, which is proportional to the inverse of the wavelength λ.
In surface texture, signals represent profiles or surfaces, so it is convenient to use wavelengths instead of frequencies, as signals are in the spatial domain.
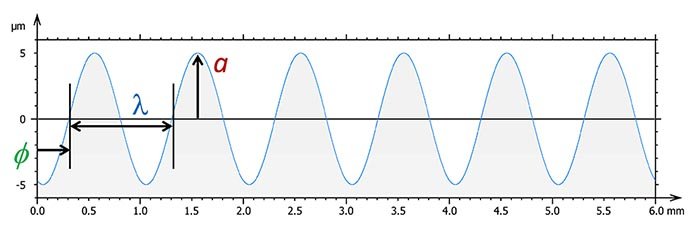
Above. The three parameters that define a sine wave: amplitude a, wavelength λ, phase Φ.
Spectral content analysis
To switch from the spatial domain to the spectral domain, or vice-versa, we use a Fourier transform, usually via an FFT algorithm which is fast and optimized.
The spatial description of a profile or surface, or its spectrum, are two different ways to describe the same object. They are dual representations. The usual representation of a spectrum is either a 1D graph that represents amplitudes in function of the frequency index, for a profile, or an image that represents amplitudes in color, in function of the X/Y indices of the 2D spectrum.
By looking at the spectrum of a signal, it is possible to identify periodic waves, as they appear as peaks on a 1D spectrum or white pixels on a 2D spectrum. Peaks can represent actual structures on the surface, such as the periods of a periodical material measure, or they can be spurious oscillations that may come from vibrations or electrical frequency leaking due to the power supply (50 or 60 Hz).
The figure on the opposite page shows several profiles and their corresponding spectrum. The spectrum of a perfectly sinusoidal wave will, by definition, consist of a single spectral ray, since its Fourier series decomposition only has one term. A signal composed of two sinusoids at different frequencies and amplitudes will show a spectrum consisting of two spectral rays. A slightly more complex signal, such as a periodic square with a non-symmetrical duty cycle, gives a spectrum consisting of the main harmonic and complementary harmonics, all of which are multiples of the main frequency.
Finally, in the case of a real periodic profile, which contains irregularities, we find the main frequency and its harmonics, but also other smaller rays around it, which represent the irregularities of the profile.
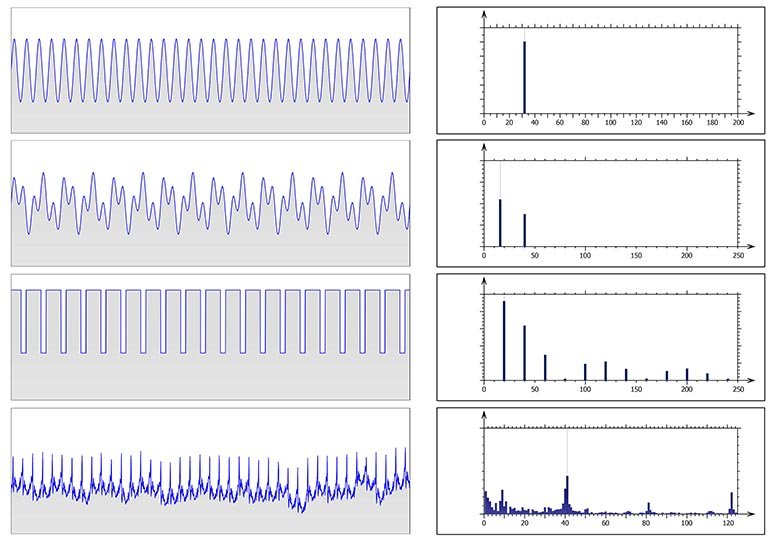
Above left. Several profile shapes. Right. Their corresponding spectrum.
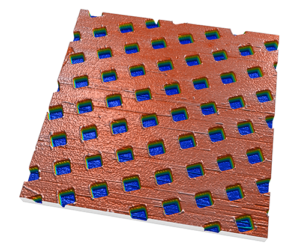
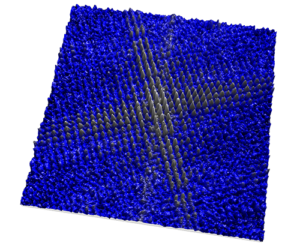
Above left. A surface. Right. Its corresponding spectrum.
Filtration
The aim of a filter is to attenuate part of the spectrum and transmit the other part. For example, by attenuating long wavelengths in a primary profile, above a cut-off value (λc or Nic), we obtain the roughness profile. It is then an L-filter (or a high-pass filter). A microroughness filter that removes the shortest wavelengths below λs (or Nis) is a S-filter.
Different filters (Gaussian, Spline, Robust Gaussian) have different frequency response curves but are all based on the same principles and the same actions on the spectrum. These filters are described in the standard series ISO 16610.
Software tools for spectral analysis
In Mountains® software, several operators and studies allow the analysis or modification of the spectrum. The Filter the spectrum operator allows the user to interactively remove spectral content from the spectrum. The Threshold the spectrum operator is an easy way to reduce noise by removing spurious frequencies.
The Frequency spectrum study displays the spectrum with a cursor to check the amplitude and phase of a particular spectral peak. The Averaged Power Spectrum Density study provides a better look at long wavelengths, and has a mode for evaluating the PSD for optical applications. Many other features are also available.
Resources :
- A recent video in the Surface Metrology Guide explains the basics of filtration and spectral analysis: www.youtube.com/watch?v=2OMrfNUt0T4
- “Filtration techniques for surface texture” article describing the differences and use cases of different filters: guide.digitalsurf.com/en/guide-filtration-techniques.html
- A special filter combination is the band-pass filter, which is described in the following article: guide.digitalsurf.com/en/guide-bandpass-filters.html