In industrial and research environments, automation has become synonymous with progress, reshaping traditional workflows and optimizing processes.
The adoption of automation tools has paved the way to better repeatability, reduced errors and increased throughput. From manufacturing lines to laboratory experiments, automated systems can help streamline operations, allowing human resources to focus on more complex and creative tasks.
However, traditional automation methods often require coding skills, limiting their use to users with high technical expertise. Deployment and iteration can be time-consuming.
Enter Mountains® surface and image analysis software no-code automation tools, designed to help non-technical users extract valuable insights from large and/or intricate datasets without the need for knowledge of scripts or macros.

Isabelle Cauwet, support and applications specialist, delves into how these software tools can boost your productivity.
If you’re reading this article, it’s perhaps because you have dozens, if not hundreds of measurements at your disposal, or you’re thinking about how to control a production process. You need to analyze and, if possible, draw conclusions from this sizeable dataset. No worries, Mountains® analysis software is here to make your life easier. After all, we designed it with you in mind. Here are a few recommendations on how to go about this.
#1 – Build your Analysis Workflow
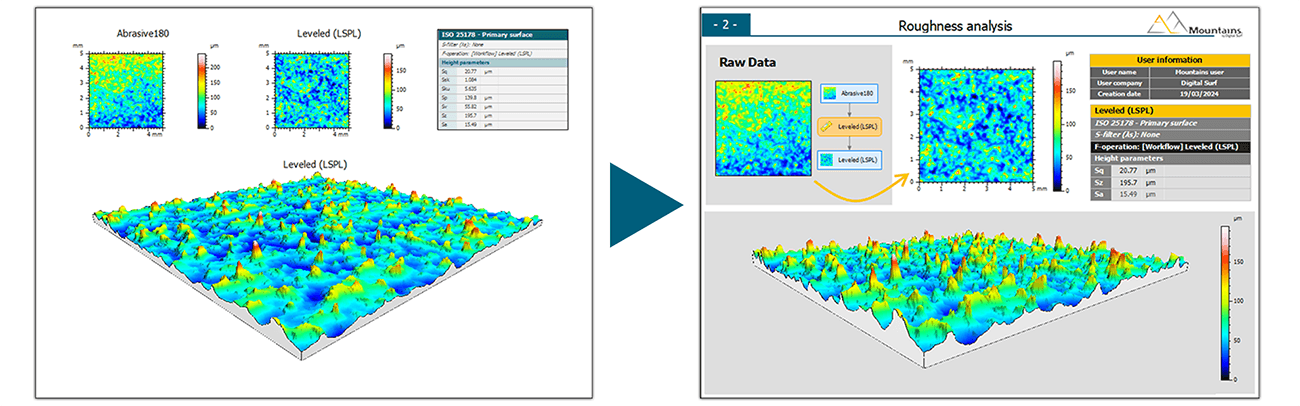
One of Mountains® greatest strengths is that it offers you the flexibility to design your own workflow. With the workflow, you’ll be able to clearly identify and modify the analysis steps you apply and get immediate visual feedback. Of course, at this stage, you can take full advantage of the Undo/Redo feature!
We also offer example workflows to guide you in your initial steps as well as a wealth of other information including an extensive Reference guide.
During this phase, once you’ve fine-tuned each part of your process (e.g., defined specific settings in the Leveling operator, chosen a particle detection method or selected the parameters you need to display), you can save your settings. This allows you to automatically reapply them to other measurements (or other batches of measurements), saving you valuable time.
#2 Test it works
Once your workflow is ready, Mountains® allows you to perform a quick test to make sure it works on all your measurements.
Testing it on measurements close to tolerance limits can be a good starting point. In Mountains®, you can easily substitute the measurement to which the workflow is applied with any other measurement. You can then adjust and check again by substituting with further datasets.
Next, you can try out the workflow on a representative subset of your data. The best tool for this is the Mountains® SmartFlow: just save your workflow as a SmartFlow, then load a batch of measurements (say a dozen). The workflow will be applied to all your measurements and the results will be displayed in one single document, which you can simply browse through to check that everything is as it should be. If adjustments are necessary, all you need to do is change the settings and re-save your SmartFlow.
#3 Polish layout and protect your document
Once your workflow is ready, you may wish to fine-tune document layout to improve clarity. You can add text, links, images, define a page background and provide information about your measurements (name, date, etc.) or about the workflow (summary, history). When your document is just the way you want it, you can save it and protect it from modifications with a password.
#4 Launch analysis on hundreds of measurements
Your document can now be used directly as a template for automation, with no need to create a macro or write code. All you need to do is apply it to the directory containing your measurements. It’s truly as simple as that.
In the blink of an eye, you’ll obtain a new document for each measurement, in Mountains® (MNT) or PDF format. You can also generate images or certain curves, or export processed data in text format for future use.
#5 Visualize a summary and statistics on your results
The numerical results calculated in each document are compiled into a single file that you can open as a spreadsheet.
Mountains® can even generate statistical summaries, monitor statistical population drift and compare populations with each other.
Automation in a production environment
Users performing quality checks in continuous production environments can also choose to design a template that the software will automatically apply to any new dataset which is injected into a particular directory or folder.
When new data is saved by your measuring instrument, Mountains® creates a new document and/or exports numerical results. Results can be automatically added to a text file and statistical studies (control charts, box plots etc.) updated immediately.
Other, integrated solutions are of course available (but that’s a story we’ll save for next time!)
In conclusion, whether you’re scaling the heights of data analysis or just getting started on your automation journey, Mountains® software is the sturdy climbing partner that can help you conquer the peaks of productivity, one step at a time. 🏔️🚀
Author : Isabelle Cauwet
Resources :
Try out Mountains® automation tools: get a free 30-day trial and expert advice from our team – www.digitalsurf.com/free-trial