Most of us tend to take the measurements around us, such as the temperature indicated by our cars or poll percentages before an election, for granted. This is also the case in metrology where it can be tempting not to question results. However, measuring one 8 mm profile on a 40 cm metal part and calculating one Ra parameter does not entitle us to draw conclusions about the roughness of the whole part. That said, observing a change in value of 0.1% between two versions of your analysis software does not necessarily mean that there is a bug. In this article François Blateyron, senior surface metrology expert at Digital Surf, discusses why results may vary and good practices to ensure they remain stable.
Variations on the same part
Surface texture specifications usually apply on a particular portion of a part, for example the upper face. If you measure a profile or a surface at different locations on the same toleranced portion, you will observe a certain dispersion in the parameter values. The smaller the measured area, the larger the dispersion. This relates to the scale of observation. Seen from a distance, the surface of a table is flat and relatively smooth. When looking at it with a microscope, you can see hills and dales, grooves and canyons. If the dispersion between several measures is high, it might mean that the measured area is too small for that texture, and/or that the surface is not homogeneous.
The example below shows 20 surfaces measured on the same sample of a brushed surface. We can see a large dispersion in values, even on parameters that are calculated as averages (such as Rq and Ra). Each surface was measured as a square of 0.8 mm x 0.8 mm using an optical profiler. On such a texture, a larger field of measurement would have probably produced more stable results.
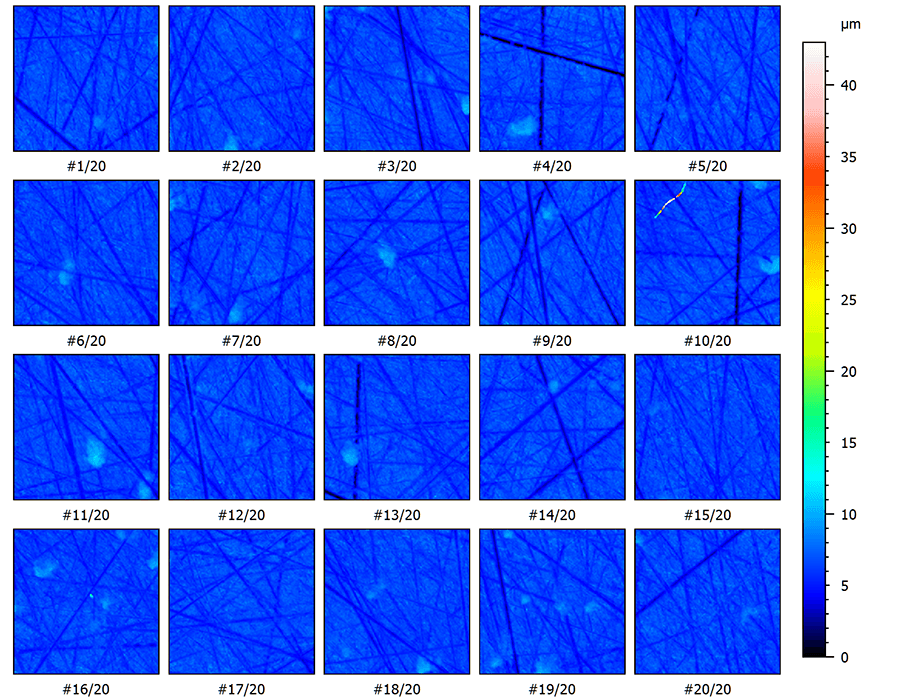
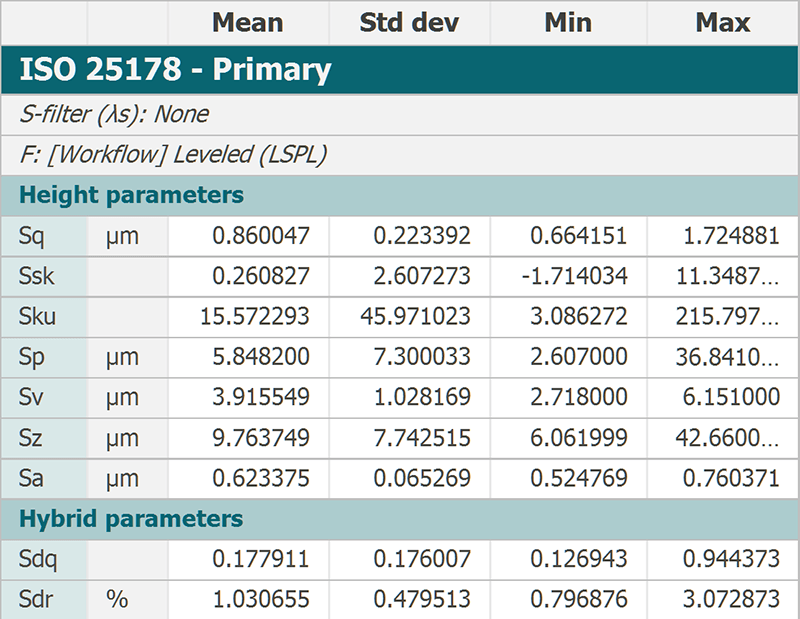
Above. 20 surfaces measured on the same sample of a brushed surface show a large dispersion in values (note that the series appears blue because of a dirt fiber visible on surface #10)
Variations within the same measured surface
A similar exercise can be performed by extracting a sub-surface from an actual measured surface.
In the following example, sub-surfaces of 40% of the size of a surface were extracted with a horizontal and vertical shift of 10%, producing 49 surfaces (see below). Here also, we observed dispersions, smaller than in the previous example (except for Ssk and Sku that are notably sensitive parameters). Similar dispersions could also be seen by changing the orientation of the measurement, by introducing slope or outliers or by changing the instrument technology (confocal, interferometer, focus variation).
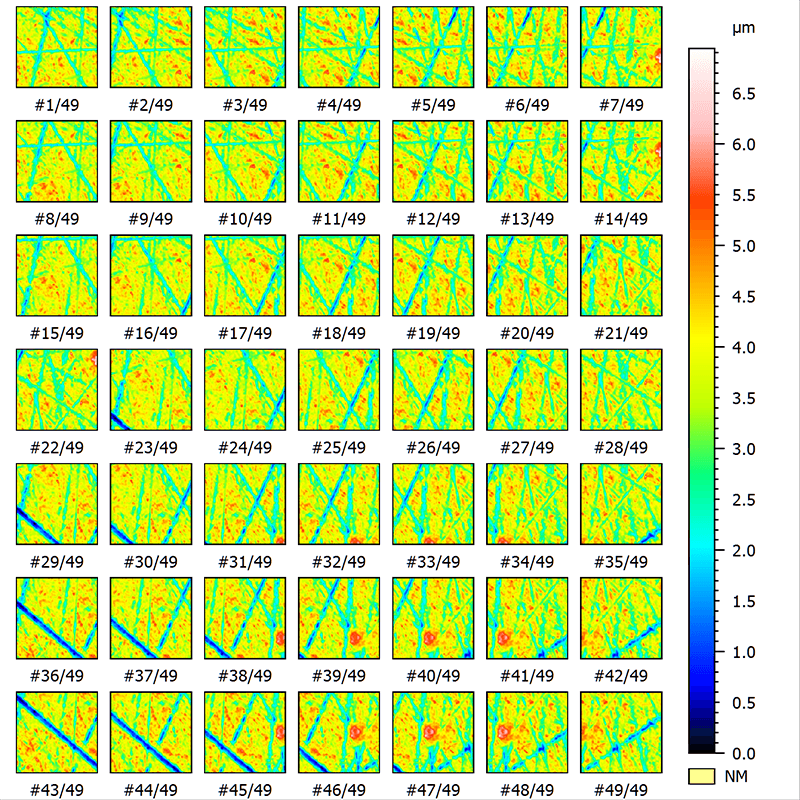
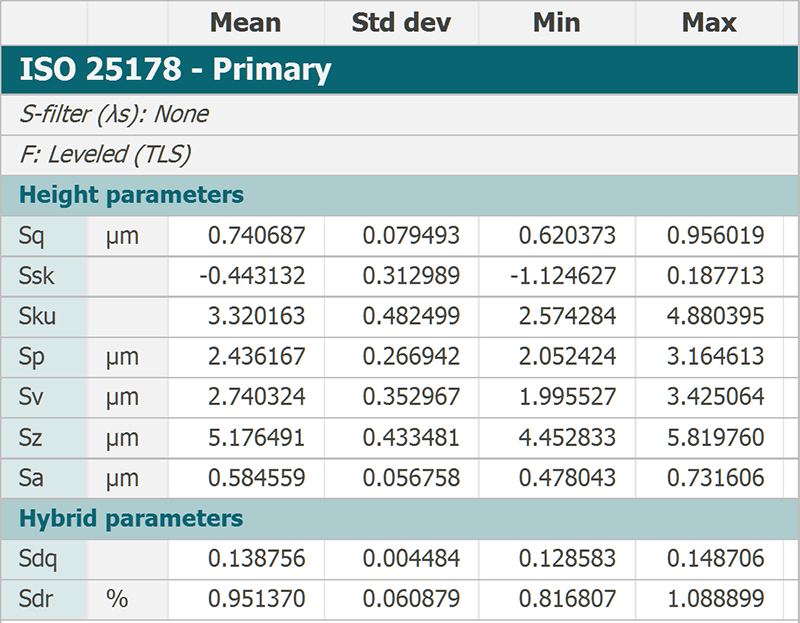
Above. 49 sub-surfaces extracted from the same measured surface display dispersions in values.
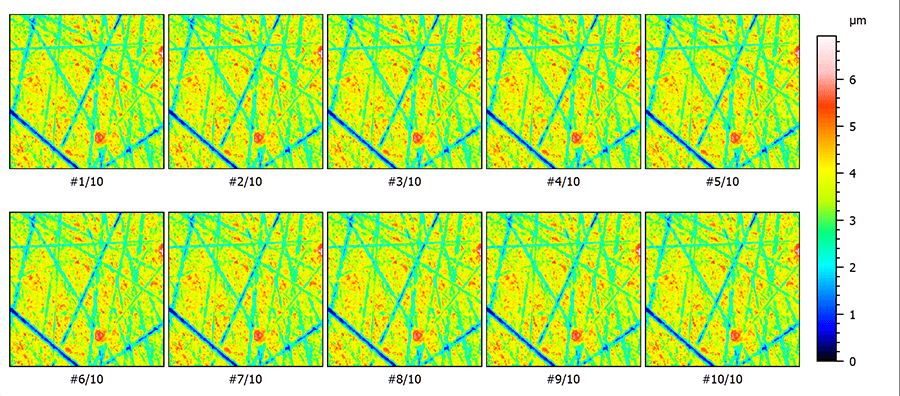
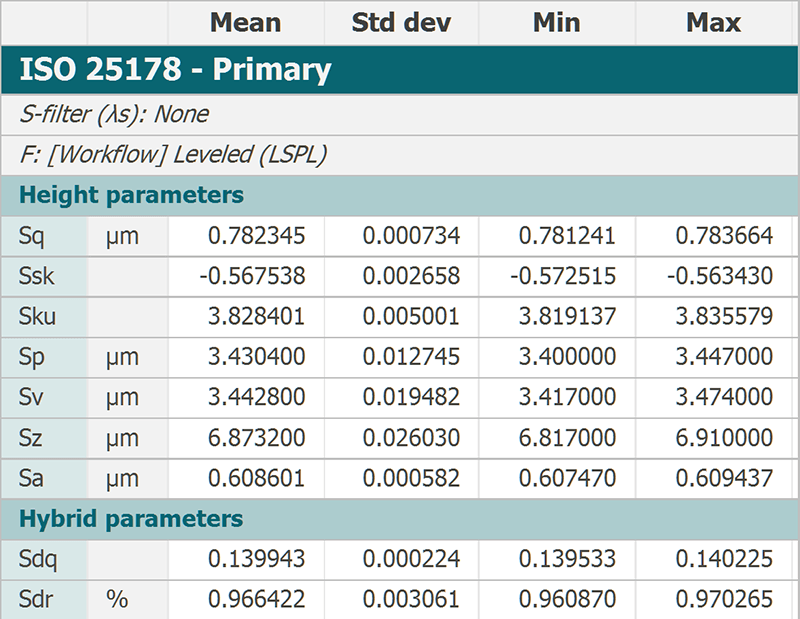
Variations between same measurements
You might think that measuring a surface several times at the same position without any changes would produce the exact same results every time. However, instruments contain electronic components that can produce noise, the measurement environment also emits small vibrations and the refractive index of air around the instrument may even vary slightly due to the body temperature of the operator.
In the example below, 10 measurements were made successively at the same position, in a short time period, yet we can still see small dispersions, especially on less stable parameters.
Variations in calculation algorithms
In a continuous effort to maintain and improve Mountains® software, we sometimes modify a particular algorithm in order to make it faster and/or more accurate. As a result, a new version may show a small difference compared to an older version. Usually, that means that the new value is more accurate. In most cases, the difference is much smaller than the one observed when taking repeated measurements at different places of the same sample.
Takeaways
- Don’t take the result of a single measurement or a single parameter for granted
- Take measurements at several places on the same sample and average results
- Discard measurements if you see dirt or obtain too many outliers
- Carefully select the field of view (objective) or the type of instrument
- Make sure you have a good knowledge of the complexity of the surface texture to be able to adapt analysis tools accordingly
Author : François Blateyron
Resources :
- guide.digitalsurf.com/en/guide-stochastic-vs-deterministic.html
- guide.digitalsurf.com/en/guide-software-verification.html
- NB: surfaces shown in this article come from the work of GDR 2077 SurfTopo (https://surftopo.cnrs.fr/)
Further reading
Stochastic and deterministic are two terms that are used more and more frequently to qualify modern surfaces. What is their meaning? How do they compare with roughness and waviness concepts? What influence do they have on surface function?