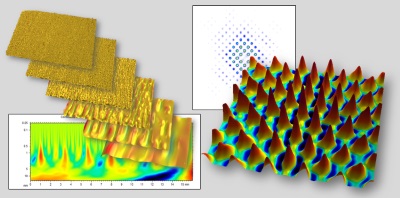
⇒ Frequency spectrum – display frequency spectrum plots for 3D surfaces with x and y, wavelength, angle, magnitude and phase – display 2D frequency spectrum plots for 2D profiles with wavelength, magnitude and phase.
⇒ Power spectral density – display the power spectral density plot and select the vertical scale and measurement location interactively (3D surfaces and 2D profiles).
⇒ Surface isotropy, directionality and periodicity – calculate isotropy, periodicity, period and period direction – view dominant surface directions on a compass rose.
⇒ Autocorrelation and intercorrelation – study 3D surface and 2D profile autocorrelation and intercorrelation.
⇒ Detect smaller spectral structures – use Hann windows to eliminate stray spectral lines.
⇒ Denoising – filter noisy profiles and surfaces by editing the FFT plot directly within selected upper and lower bounds.
⇒ Continuous wavelet decomposition – visualize the scales and spatial locations where phenomena occur on 2D profiles – use Coiflet 1-5, Daubechies 1-10, Discrete Meyer, Gauss 1-8, Mexican Hat, Morlet and Symlet 1-8 wavelet.
⇒ Discrete wavelet filtering – decompose a 2D profile or 3D surface into a set of profiles or surfaces at different levels of scale – select the scale levels for inclusion in the roughness profile and hence the waviness profile – use Coiflet, Daubechies, Discrete Meyer, Spline and Symlet wavelet families (wavelet spline filtering is an advanced filtering technique defined in ISO 16610).
Included in:
- MountainsMap® Premium
- MountainsLab® Premium
Available with:
- MountainsMap® Topography
- MountainsMap® Imaging Topography
- MountainsMap® Expert
- MountainsSEM® Expert
- MountainsSEM® Premium
- MountainsLab® Expert