When using new software, getting started can be tricky. But did you know that MountainsMap® product users benefit from personalized assistance right from the word go? As well as access to a whole host of online resources, this includes technical support supplied by an in-house team who will guide you while you get accustomed to the software and answer any questions you may have on specific applications. Let’s have a look at one customer’s first steps using the software and see what he was able to achieve within the first few weeks of use.
Peter Van Rompuy is Primary Lab Technician with Agfa-Gevaert, provider of imaging systems and IT solutions for the printing and healthcare industries (HQ located in Mortsel, Belgium). He recently acquired MountainMap® software to analyze the broad range of samples and analysis requests from internal research departments and the company’s open innovation platform AgfaLabs (see www.agfa.com/sp/global/en/internet/agfa-labs/).
What instruments do you work with?
In 2002 we bought a stylus profiler, quickly followed by an interferometer and later on a confocal microscope. Now, 15 years later, we have 6 other interferometers worldwide for quality control purposes! A growing business…
What are the main challenges of your work?
At the central research department of Agfa-Gevaert we are challenged by a lot of issues. We characterize new materials but we also support our different business group’s research and application departments. Furthermore, our open innovation platform AgfaLabs is growing consistently and demands high-tech equipment, software and knowledge.
Up until now we were using our interferometer application software for all topographical analyses. A user-friendly software with lot of capabilities but also with some restrictions with respect to more complex analysis requests.
How did you hear about MountainsMap®?
At the end of last year a colleague told me about MountainsMap®. I was interested and had a look on the Digital Surf website. I decided to download the trial version and soon realized the software would have an added value for our research department!
What were your first impressions?
Installation and initialization were trouble free. The screen layout was innovative and functional but to be honest, it was not easy to begin with. I was not used to working with a ribbon toolbar which changes depending on which operator or study is selected. I was not familiar with the nomenclature used by the software (studiables, operators, studies and Minidocs). But I soon discovered some nice tutorials and examples together with a splendid on-line manual. Once you know how to open a dataset, perform some processing actions and analyze the processed data, I was surprised how easy and smooth the whole analysis worked out, resulting in a nice report!
What are the features you find most useful?
A very fine feature is the fact you can swap the loaded dataset with a new one and processing is done automatically, generating a new report! You can also save a report as a template for further use (called “minidocs”). At the right of the screen you will find an analysis workflow containing all the processing steps. At first it didn’t know the added value of this list but soon you realize this is the place to alter settings in order to fine-tune your analysis. Once again, the software carries out the new processing immediately.
A very nice feature of MountainsMap® is the fact you can load almost any commercially used topographic file. Also, MountainsMap® processed files can be converted to instrument-type files for further use in the instrument-related software or to be further analyzed by our customer’s applications.
What additional modules do you use?
We decided to buy the MountainsMap® Universal package with some extra optional modules: Grains & Particles, 3D Fourier & Wavelets and Advanced 3D surface texture. These modules are of great importance with respect to topographical analysis of spatial features. It is worth mentioning that this software package is extremely useful for dedicated wavelength or wavelet filtering of the measured surface texture. The Fourier analysis gives us the possibility to evaluate spatial features while the Grains & Particles module is useful for segmenting and characterizing local features.
What helped you most in your first few weeks using the software?
Aside from the software capabilities, I was very impressed by the comprehensive online reference guide (or the printed version like we have!) This guide is not just a manual but also a tutorial providing very useful information regarding all existing filter techniques and analysis algorithms. Furthermore textural parameters in MountainsMap® are categorized into their ISO standard group. This is very useful when you have to work according a certain ISO standard.
To finalize this review it is worth mentioning Digital Surf’s user-friendly customer support. It was not easy to start using the software (I didn’t expect it would be!). Sometimes you wonder if a certain feature is available or not or you don’t immediately find a solution in the help manual. At these times, you really need good and quick responding customer support. I must say, thumbs up for Digital Surf’s support. They assist you by generating an analysis report with the necessary comments. Even when I was using the trial version I was able to benefit from email support many times.
In conclusion, superb software and great support! In my opinion, MountainsMap® is the way to go if you want to raise the bar and get the most out of your topographic datasets.
Tell us about your applications
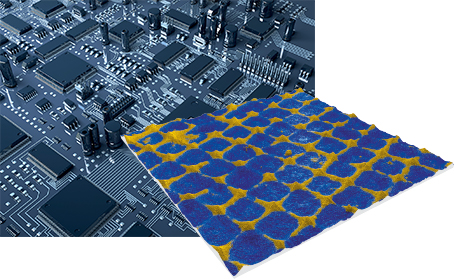
“One of the things we have been using MountainsMap® for in particular is studying substrates printed with conductive inks in the aim of improving the performance of our printed electronics products. Measuring the exact height of these inks is very important to us as their conductivity depends on this factor (see figure 1). We also need to quantify volume (figure 2) and area.
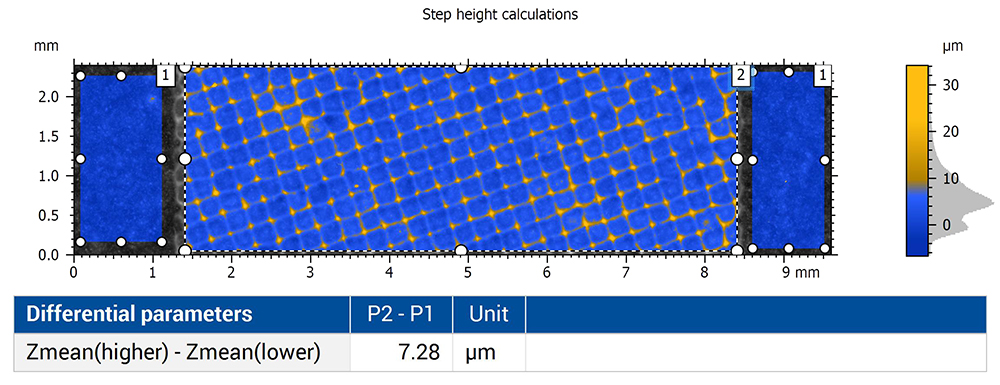
Figure 1. Height measurement of conductive ink
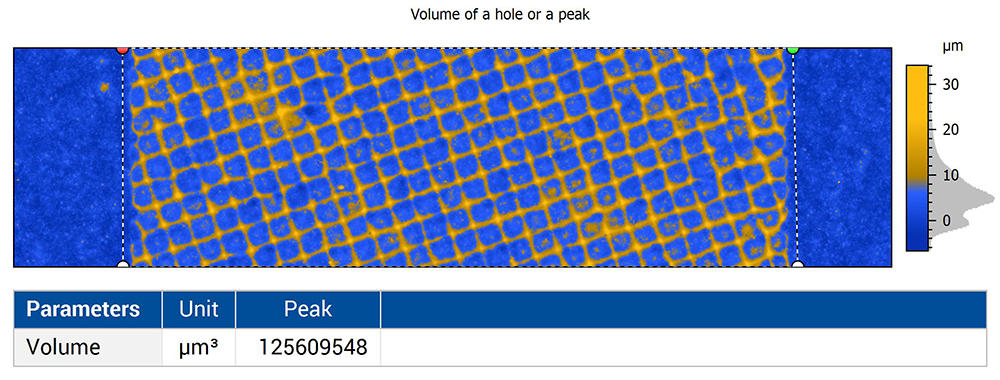
Figure 2. Volume measurement of the sample
We also use MountainsMap® to analyze the hardness of our synthetic paper. After performing an indentation test, we measure the “damaged” surface with our interferometer. However, this type of surface is difficult to measure due to the diffuse light scattering. Measurement of the center of the indentation is of good quality but the steep edges of the indentation pit result in a lot of non-measured points.
By means of MountainsMap®, it is easy to process these images (using the Filter and Remove outlier operators). We then are able to extract a representative 2D profile which runs through the center of the indentation.”
New to Mountains® software? Have any questions?
Bertrand, Damien and Catharine from the Mountains® support team would be happy to help.
If you are working with an OEM version of the software, you may contact your instrument manufacturer directly.
Support solutions